Energy Usage Chart by Machine
Monitor Machine-Level Energy Consumption in Real Time
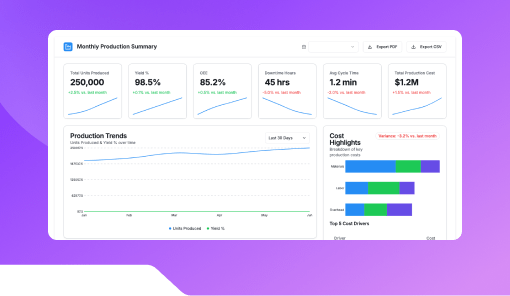
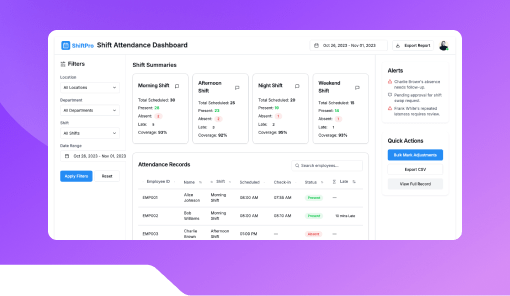
Machine energy usage dashboard


See Energy Usage Chart by Machine. In Action
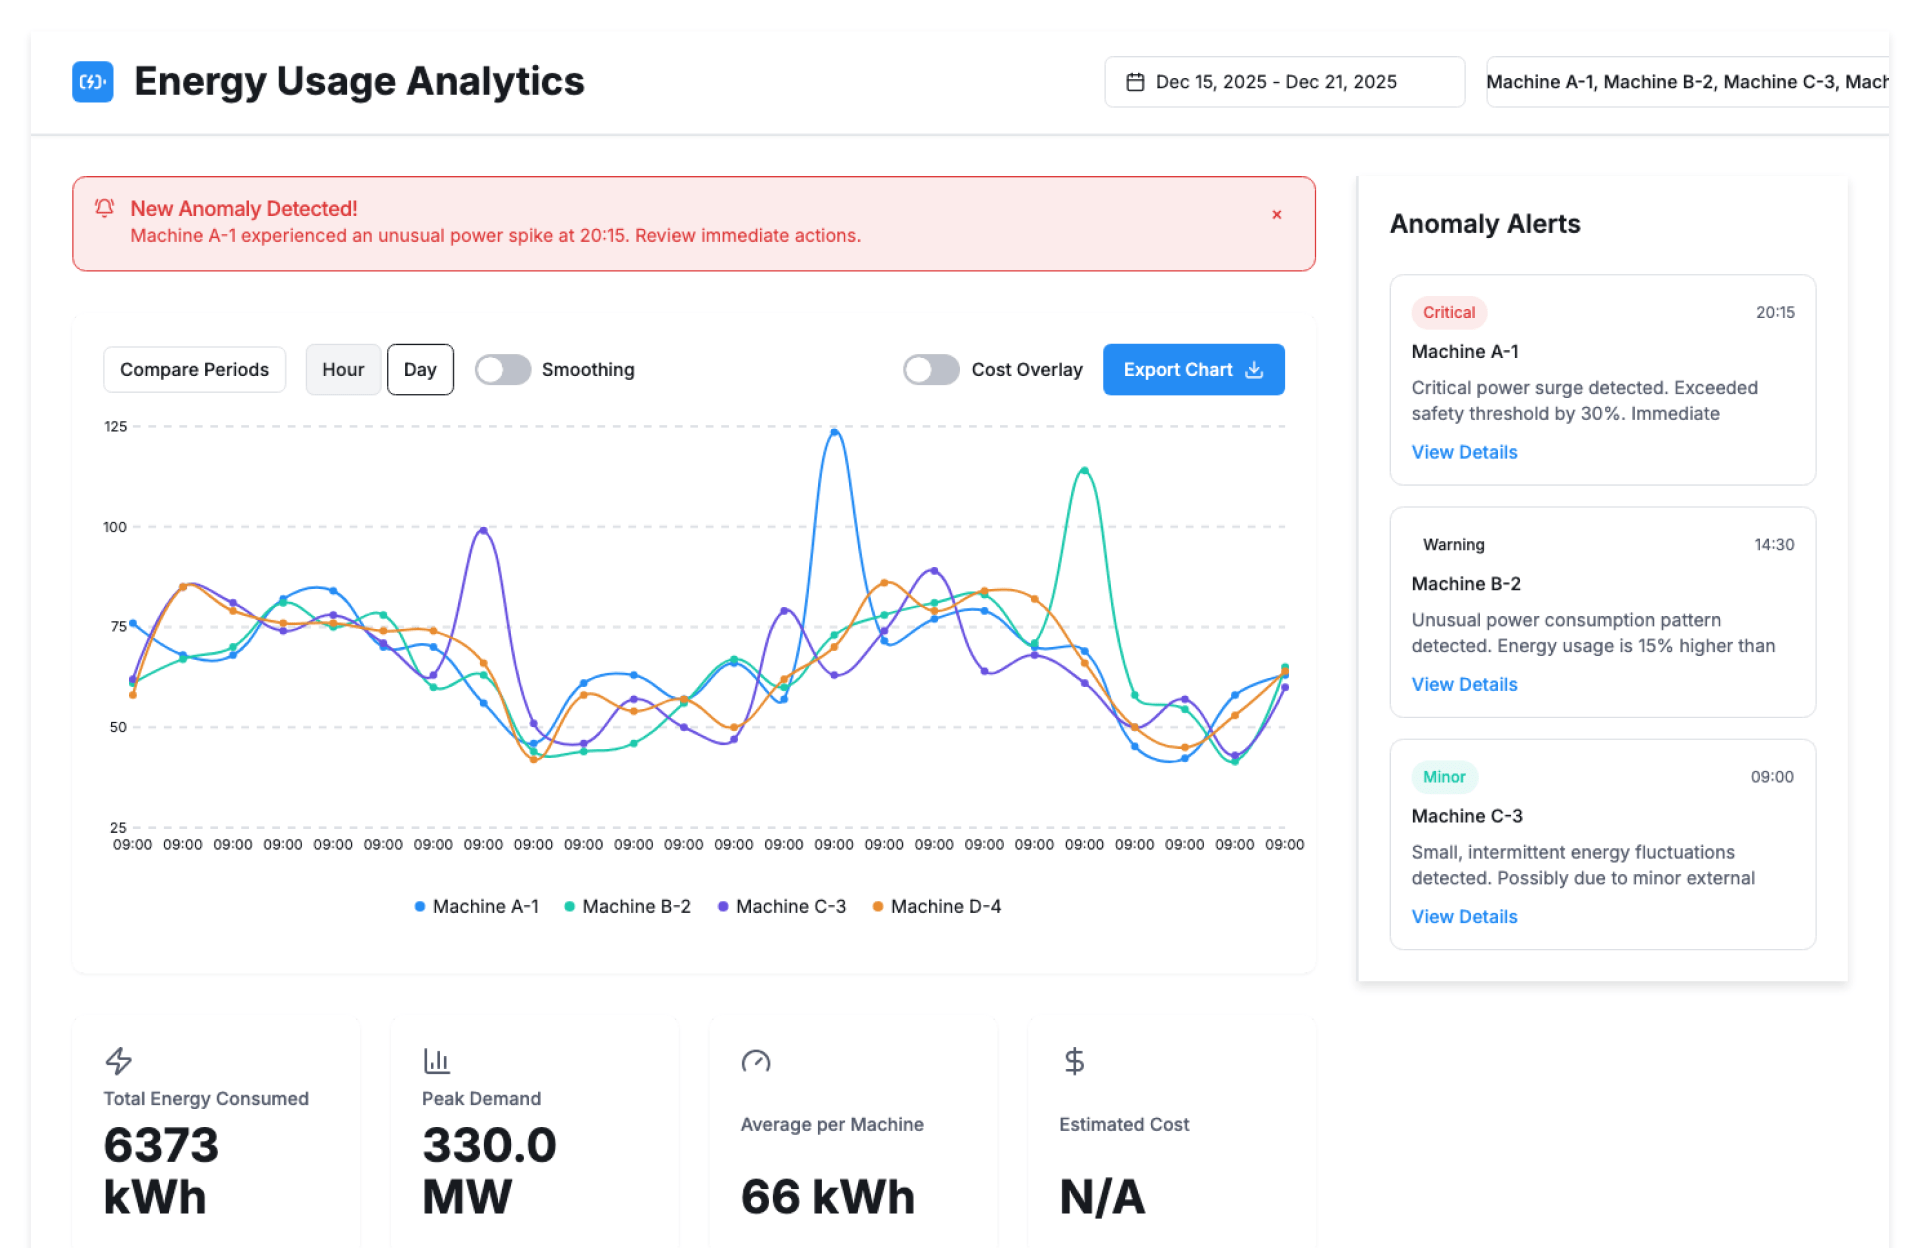
The Energy Usage Chart by Machine by Kriatix helps manufacturing and operations teams visualize and analyze energy consumption at the machine level. By tracking usage patterns across equipment, teams can identify inefficiencies, reduce energy costs, and support sustainability initiatives.
🔹 Start Free Trial
🔹 Book a Demo
🔹 Request Pricing
What Is the Energy Usage Chart by Machine?
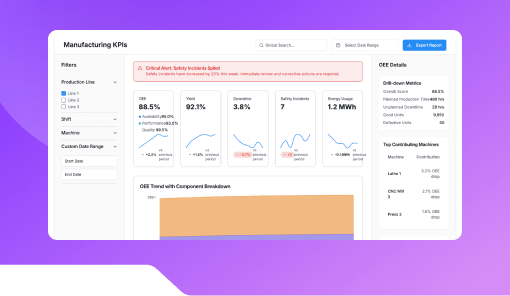
The Energy Usage Chart by Machine is an AI-powered analytics solution that displays energy consumption data for individual machines in an easy-to-understand visual format. It enables teams to monitor trends, compare equipment performance, and detect abnormal energy usage.
Who Is It For?
| Role | How They Benefit |
|---|---|
| Plant Managers | Control energy costs by equipment |
| Maintenance Teams | Identify inefficient or faulty machines |
| Energy Managers | Track and optimize energy usage |
| Operations Teams | Improve machine efficiency |
| Leadership | Support sustainability and cost goals |
Key Features
- Machine-level energy usage visualization
- Real-time and historical consumption charts
- Machine comparison and trend analysis
- Abnormal usage detection
- Time-based filtering (shift, day, month)
- Exportable reports and dashboards
- Centralized energy data view
Benefits
- Reduce energy costs through visibility
- Identify high-consumption machines
- Detect inefficiencies early
- Support energy optimization initiatives
- Improve operational decision-making
- Strengthen sustainability reporting
How It Works
- Capture Energy Data – Collect usage data per machine
- Visualize Consumption – Display data in charts
- Analyze Trends – Compare machines and periods
- Identify Issues – Spot abnormal energy usage
- Optimize Usage – Take corrective action
Add-ons & Integrations
- IoT sensors and meters
- Manufacturing execution systems
- Maintenance management tools
- Analytics and reporting platforms
- Energy management systems
Deployment & Access
- Web-based access
- Cloud-hosted or On-Premise deployment
- Role-based dashboard access
- Enterprise-grade data security
What Our Partners Are Saying

"Company AI-powered interfaces have been praised for their usability ,Through exhaustive research and advanced automation, Kriatix made the application fluid, accessible, and future-ready for all users. The team adapted quickly to deliver complex AI-driven tasks and independently developed creative, detailed solutions. Their AI chatbot services stood out in particular — seamlessly integrating conversational AI that enhanced user engagement and streamlined support."
Amit Kumar
Co-Founder, Venture Transform Strategy Consulting LLP

"Kriatix.ai delivered the AI-powered application on time, leveraging Agile methodology to ensure flexibility and efficiency. The team conducted bi-weekly demos, keeping the project transparent and aligned with our goals. Using Jira, GitHub, and Slack, they maintained flawless communication and streamlined project management.Their integration of AI chatbots for real-time feedback loops accelerated our release cycle by nearly 25% and reduced manual validation efforts by 40%, resulting in a smoother, faster, and higher-quality delivery."
Sumit Kumar
CEO, HImalayan Basket Private Limiteds

"The AI-powered website delivered by Kriatix.ai is both visually appealing and high-performing they built a website that not only impressed us with its sleek design but also outperformed our expectations in speed and functionality. Their team worked as true partners—creative, experienced, and highly attentive to every detail.By integrating AI personalization and intelligent chatbots, the website now adapts to user behavior in real time, leading to a 35% increase in engagement and a 25% reduction in support queries."
Sneha Das
CEO, Ittisa
"Kriatix.ai completed the deliverables with excellence, often going the extra mile by suggesting AI-driven alternatives to our change requests. The workflow was seamless, with the team being timely and proactive in addressing every issue. They set realistic expectations, built intelligent automation into our processes, and delivered results with superb quality.Their AI chatbot integration not only streamlined support but also improved responsiveness, ensuring our users always received accurate and instant assistance."
Gururaj Mahale
Director of Growth Marketing, SYNERGOS
Frequently Asked Questions
Can energy usage be tracked in real time?
Yes, real-time data visualization is supported.
Does it support multiple machines?
Yes, usage can be tracked per machine.
Can historical data be analyzed?
Yes, past consumption trends are available.
Are abnormal usage alerts available?
Yes, unusual patterns can be identified.
Can reports be exported?
Yes, charts and reports can be downloaded.
Ready to Automate Smarter with Kriatix?
Build next-gen, AI-powered apps and workflows—faster, smarter, and tailored to your industry.
Get StartedRelated Products