Return Analytics Dashboard
Understand Returns, Reduce Losses & Improve Product Decisions
Return analytics dashboard


See Return Analytics Dashboard In Action
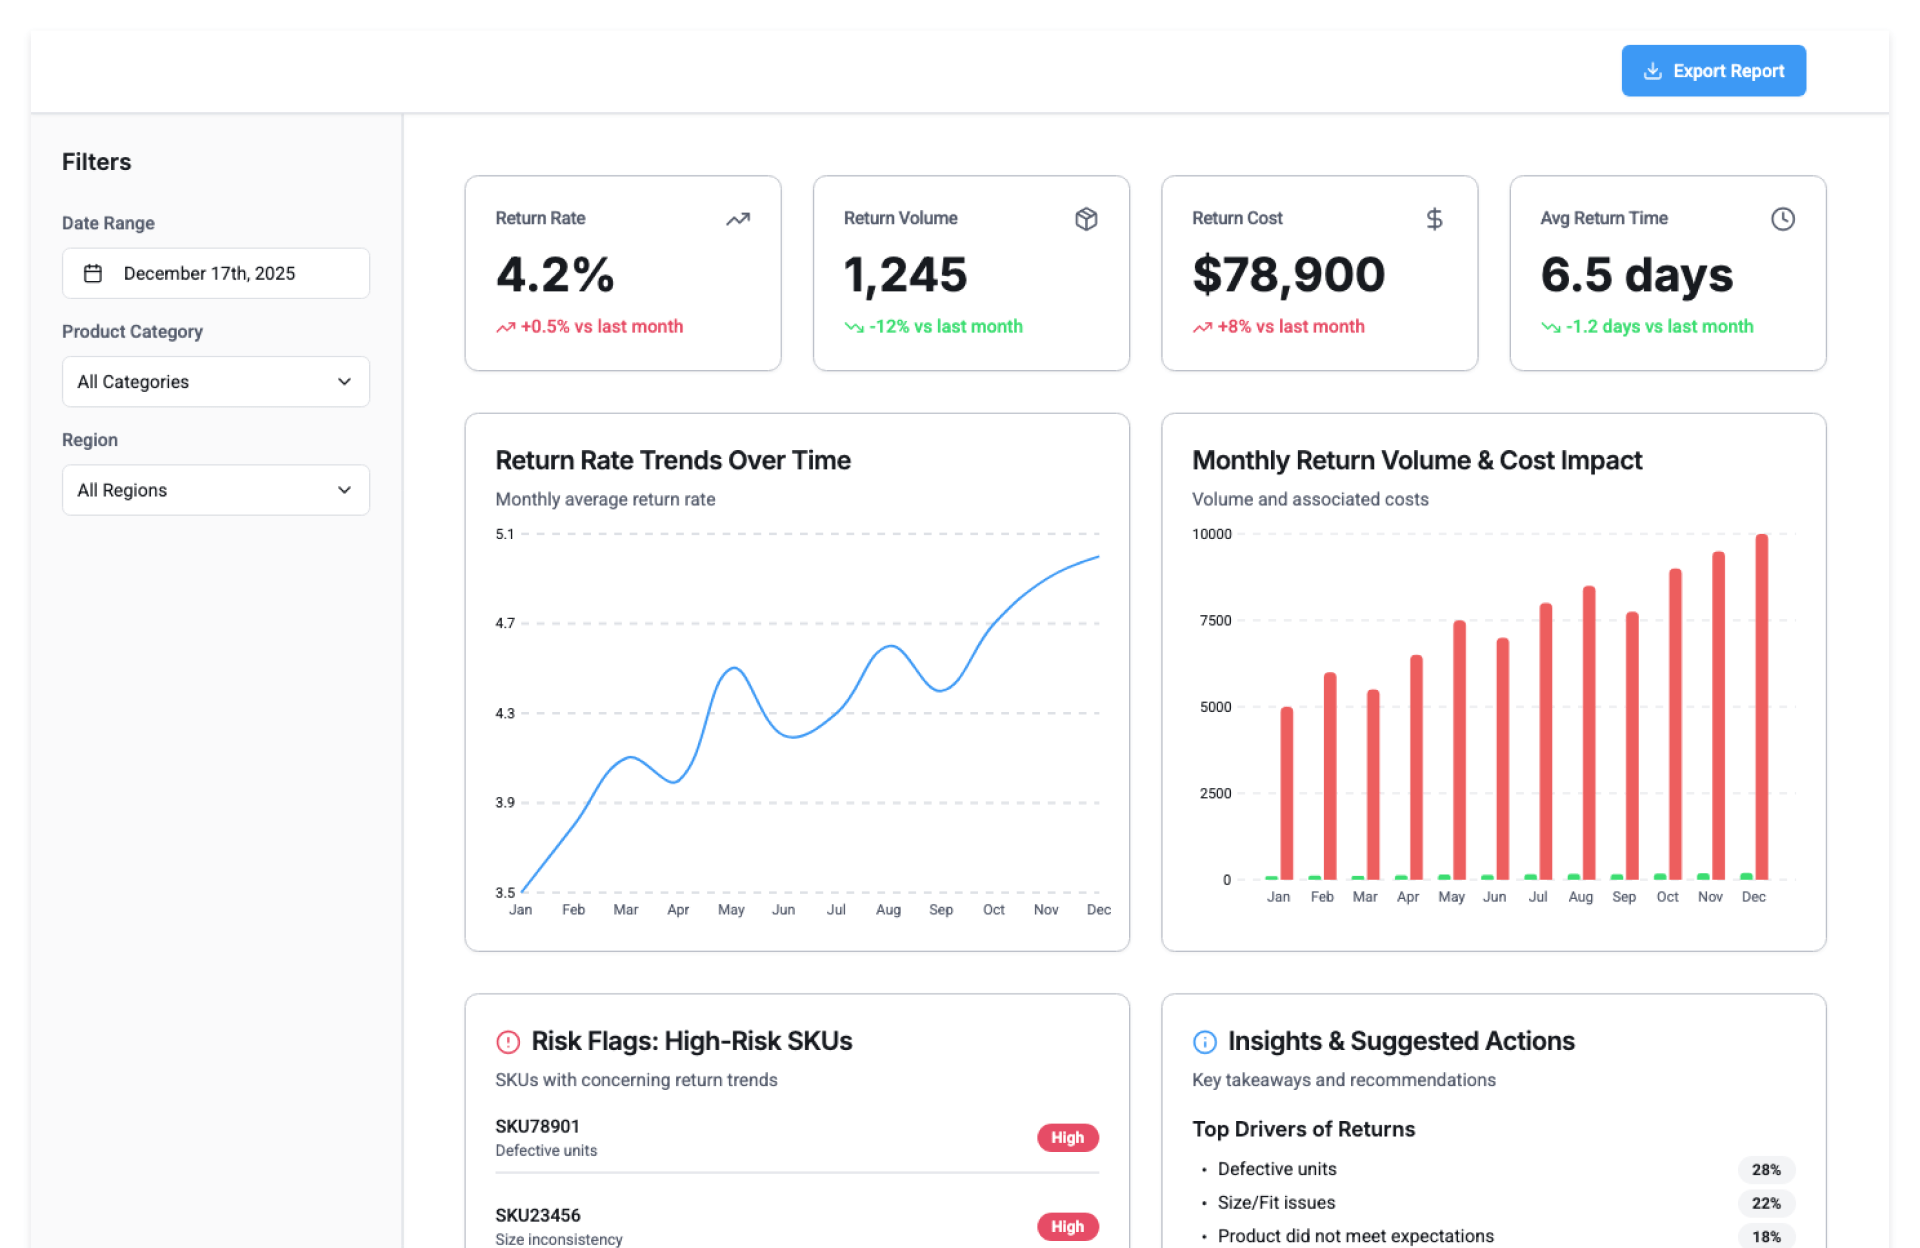
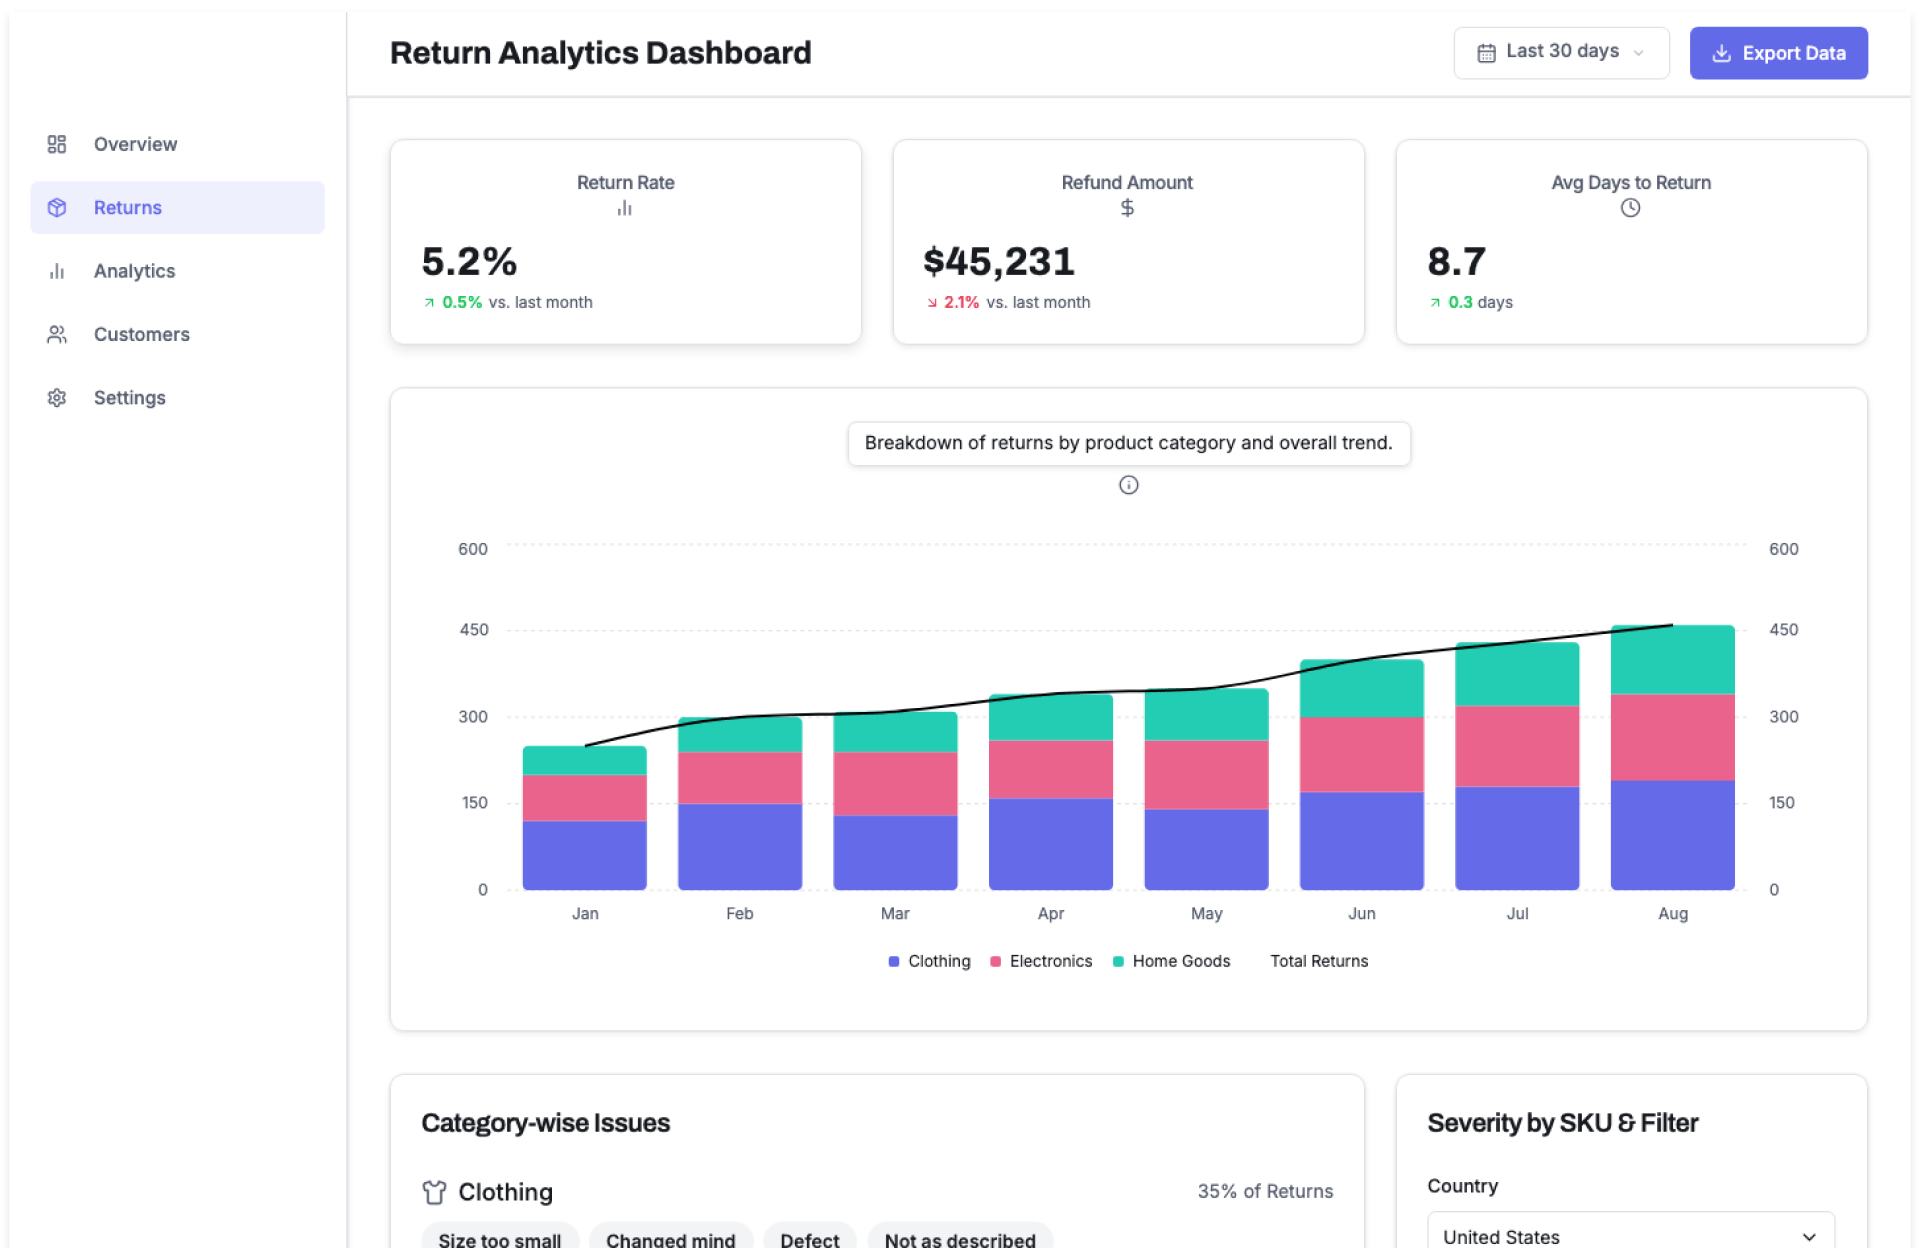
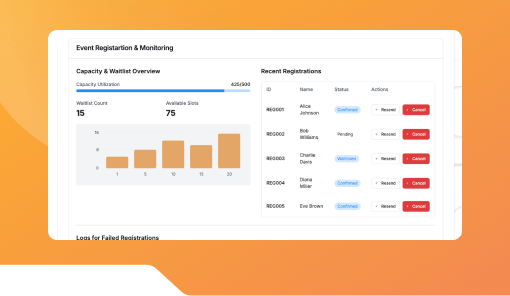
The Return Analytics Dashboard by Kriatix gives sellers, product teams, and operations leaders clear visibility into why products are returned and how returns impact revenue. It turns return data into actionable insights so teams can reduce avoidable returns and improve customer satisfaction.
🔹 Start Free Trial
🔹 Book a Demo
🔹 Request Pricing
What Is the Return Analytics Dashboard?
The Return Analytics Dashboard is a centralized reporting tool that tracks product returns, refund patterns, and return reasons across channels. It helps teams identify root causes, spot trends, and take corrective action without relying on manual reports.
Who Is It For?
| Role | How They Benefit |
|---|---|
| Marketplace Sellers | Identify products with high return rates |
| Product Managers | Improve product quality and descriptions |
| Operations Teams | Reduce return-related costs |
| CX Managers | Understand customer dissatisfaction drivers |
| Business Owners | Minimize revenue leakage from returns |
Key Features
- Return rate tracking by product and category
- Return reason analysis
- Refund value and volume insights
- Time-based return trend analysis
- Channel-wise return visibility
- High-risk product identification
- Exportable analytics reports
Benefits
- Understand why customers return products
- Reduce avoidable returns and refunds
- Improve product listings and quality decisions
- Control revenue loss due to returns
- Align teams with data-backed insights
- Replace manual return analysis with dashboards
How It Works
- Sync Return Data – Connect order, return, and refund systems
- Analyze Return Patterns – Track reasons and frequency
- Monitor Trends – Compare return rates over time
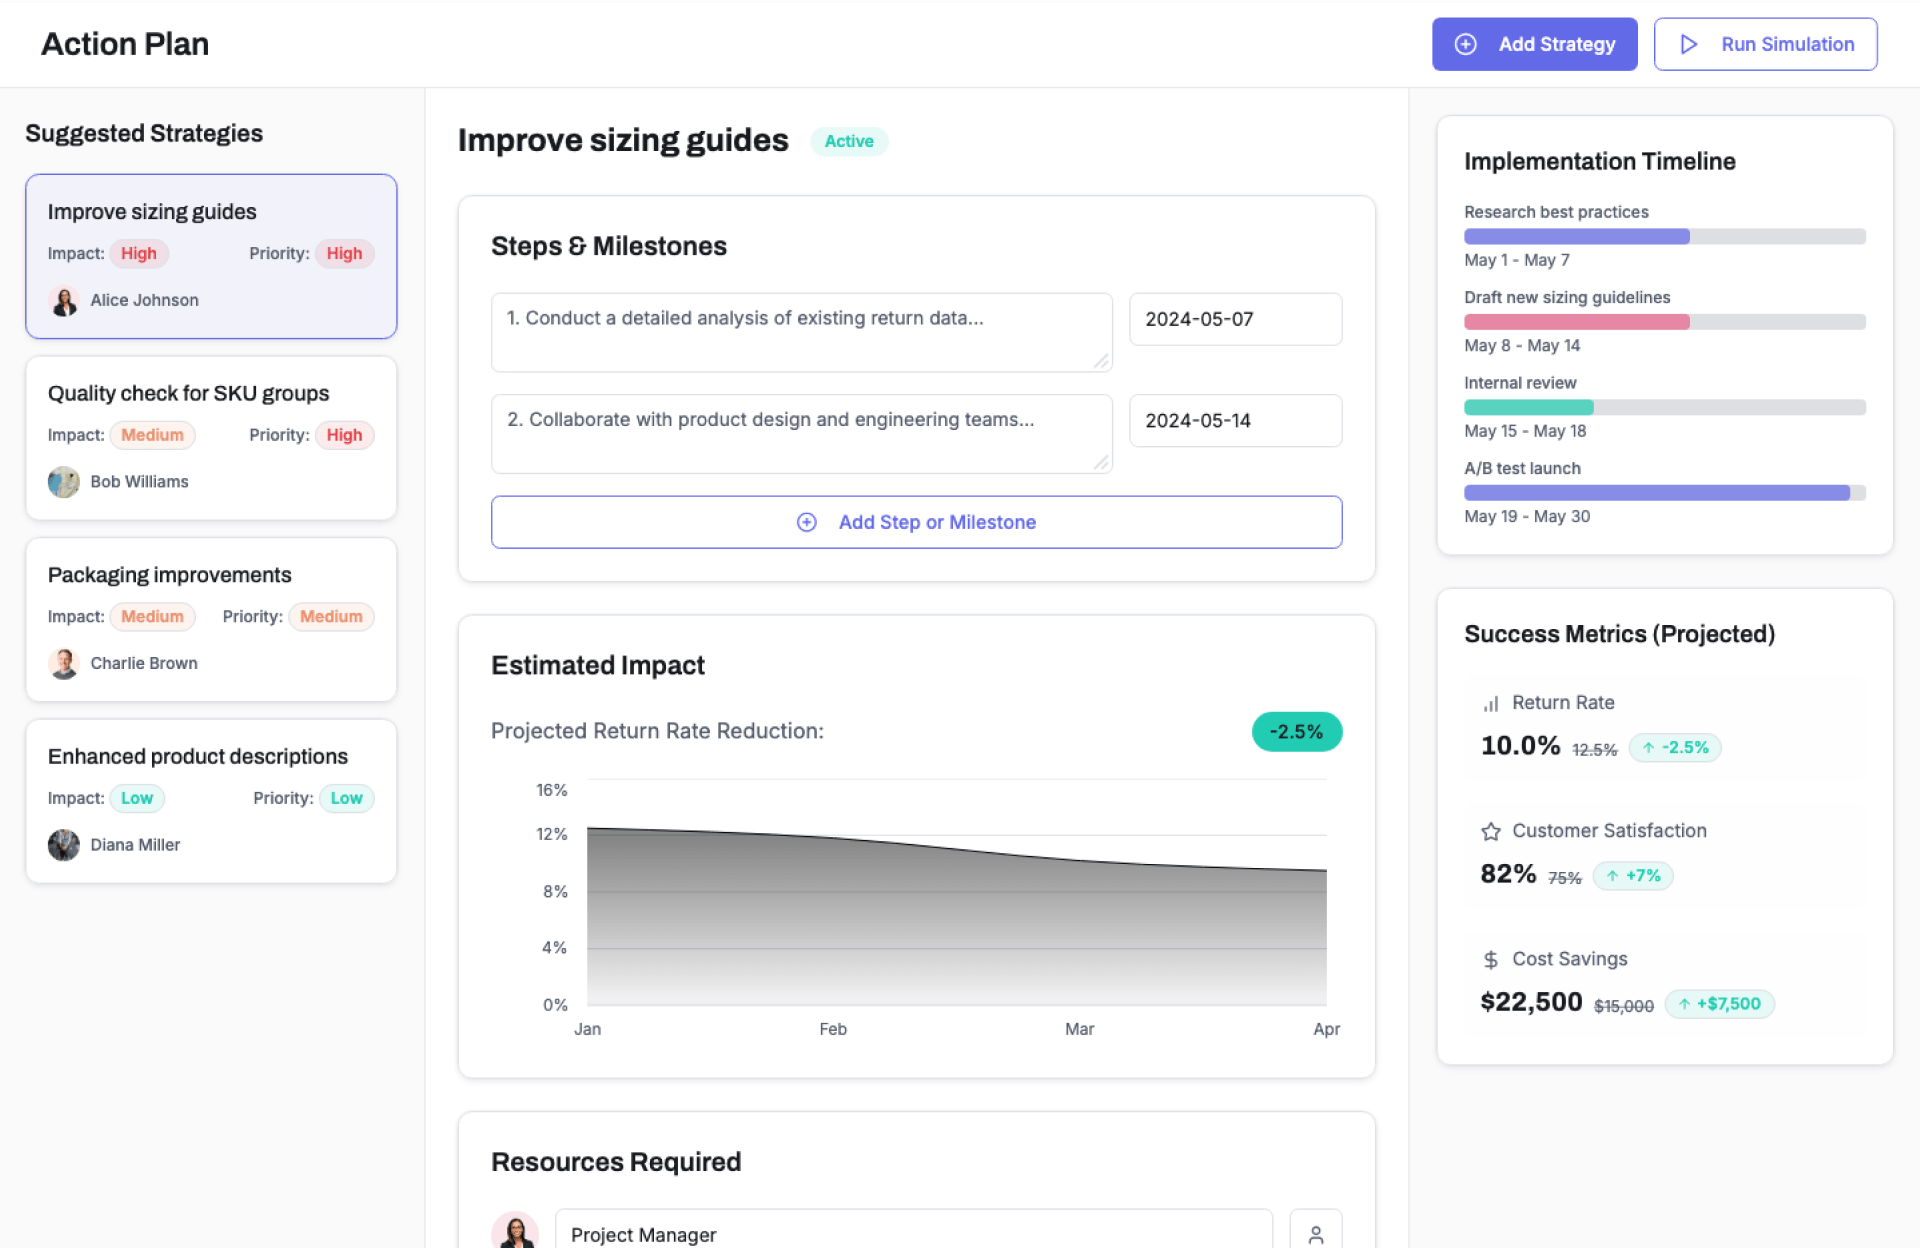
- Identify Issues – Highlight products or categories at risk
- Act & Improve – Fix root causes and track impact
Add-ons & Integrations
- Order & Refund Management Systems
- Product Performance Tracker
- CX & Support Analytics
- Export to CSV / BI Tools
- API Access
Deployment & Access
- Web-based access
- Cloud-hosted SaaS deployment
- Secure role-based access
- Enterprise-ready configuration
What Our Partners Are Saying

"Company AI-powered interfaces have been praised for their usability ,Through exhaustive research and advanced automation, Kriatix made the application fluid, accessible, and future-ready for all users. The team adapted quickly to deliver complex AI-driven tasks and independently developed creative, detailed solutions. Their AI chatbot services stood out in particular — seamlessly integrating conversational AI that enhanced user engagement and streamlined support."
Amit Kumar
Co-Founder, Venture Transform Strategy Consulting LLP

"Kriatix.ai delivered the AI-powered application on time, leveraging Agile methodology to ensure flexibility and efficiency. The team conducted bi-weekly demos, keeping the project transparent and aligned with our goals. Using Jira, GitHub, and Slack, they maintained flawless communication and streamlined project management.Their integration of AI chatbots for real-time feedback loops accelerated our release cycle by nearly 25% and reduced manual validation efforts by 40%, resulting in a smoother, faster, and higher-quality delivery."
Sumit Kumar
CEO, HImalayan Basket Private Limiteds

"The AI-powered website delivered by Kriatix.ai is both visually appealing and high-performing they built a website that not only impressed us with its sleek design but also outperformed our expectations in speed and functionality. Their team worked as true partners—creative, experienced, and highly attentive to every detail.By integrating AI personalization and intelligent chatbots, the website now adapts to user behavior in real time, leading to a 35% increase in engagement and a 25% reduction in support queries."
Sneha Das
CEO, Ittisa

"Kriatix.ai completed the deliverables with excellence, often going the extra mile by suggesting AI-driven alternatives to our change requests. The workflow was seamless, with the team being timely and proactive in addressing every issue. They set realistic expectations, built intelligent automation into our processes, and delivered results with superb quality.Their AI chatbot integration not only streamlined support but also improved responsiveness, ensuring our users always received accurate and instant assistance."
Gururaj Mahale
Director of Growth Marketing, SYNERGOS
Frequently Asked Questions
What return data does the dashboard track?
Return rates, reasons, refund values, and trends.
Can returns be analyzed by product or category?
Yes, analysis is available at product, category, and channel levels.
Does it help identify high-risk products?
Yes, it highlights products with unusually high return rates.
Can reports be exported?
Yes, return analytics reports can be downloaded.
Does it integrate with order systems?
Yes, it connects with order, return, and refund data sources.
Ready to Automate Smarter with Kriatix?
Build next-gen, AI-powered apps and workflows—faster, smarter, and tailored to your industry.
Get StartedRelated Products