Investment Tracker Dashboard
Monitor, Analyze, and Optimize Your Investments in One View
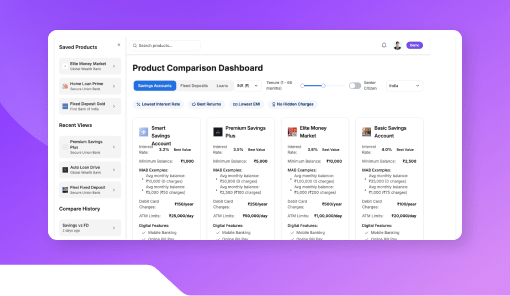
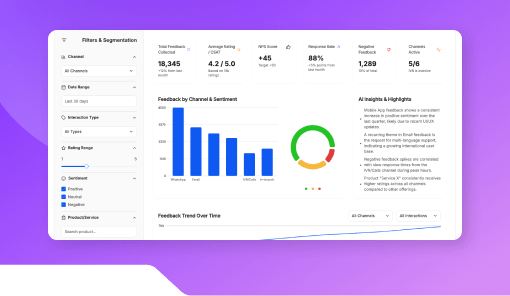
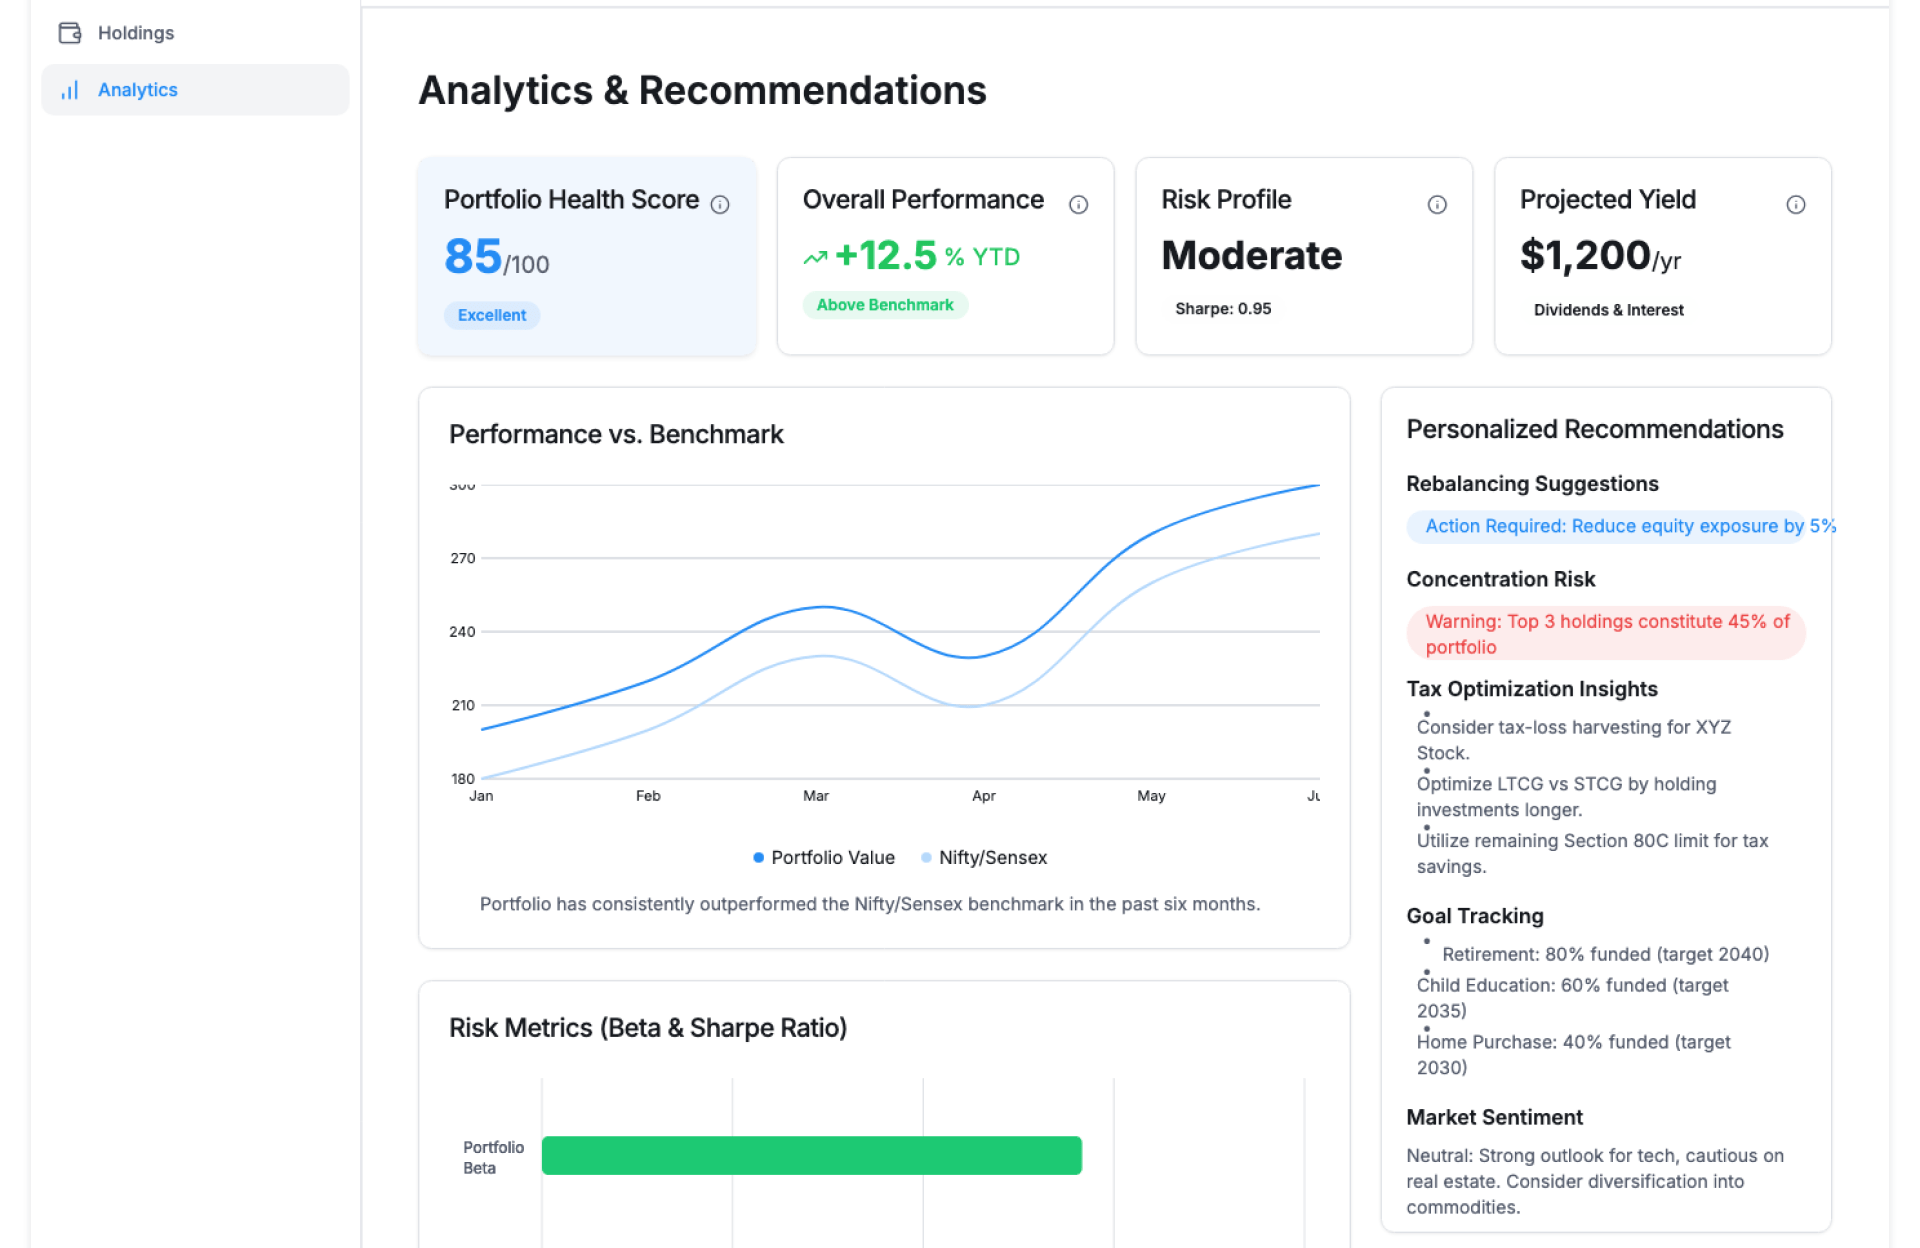
Visualize asset mix and returns.


See Investment Tracker Dashboard In Action
The Investment Tracker Dashboard by Kriatix gives investors and finance teams a consolidated view of portfolios across asset classes. It tracks performance, allocations, gains, and trends in real time so decisions are based on clarity, not guesswork.
Built for growing portfolios, it brings structure and visibility to investment management.
🔹 Start Free Trial
🔹 Book a Demo
🔹 Request Pricing
What Is the Investment Tracker Dashboard?
The Investment Tracker Dashboard is a configurable analytics interface that aggregates investment data into a single, easy-to-read view. It helps users track portfolio value, returns, and allocation across instruments while comparing performance over time.
The dashboard adapts to different investment strategies, reporting needs, and review cycles.
Who Is It For?
| Role | How They Benefit |
|---|---|
| Individual Investors | Track portfolio performance clearly |
| Wealth Managers | Monitor multiple client portfolios |
| Finance Teams | Analyze investment exposure and returns |
| Analysts | Identify trends and performance gaps |
| Founders & CXOs | Get a snapshot of investment health |
Key Features
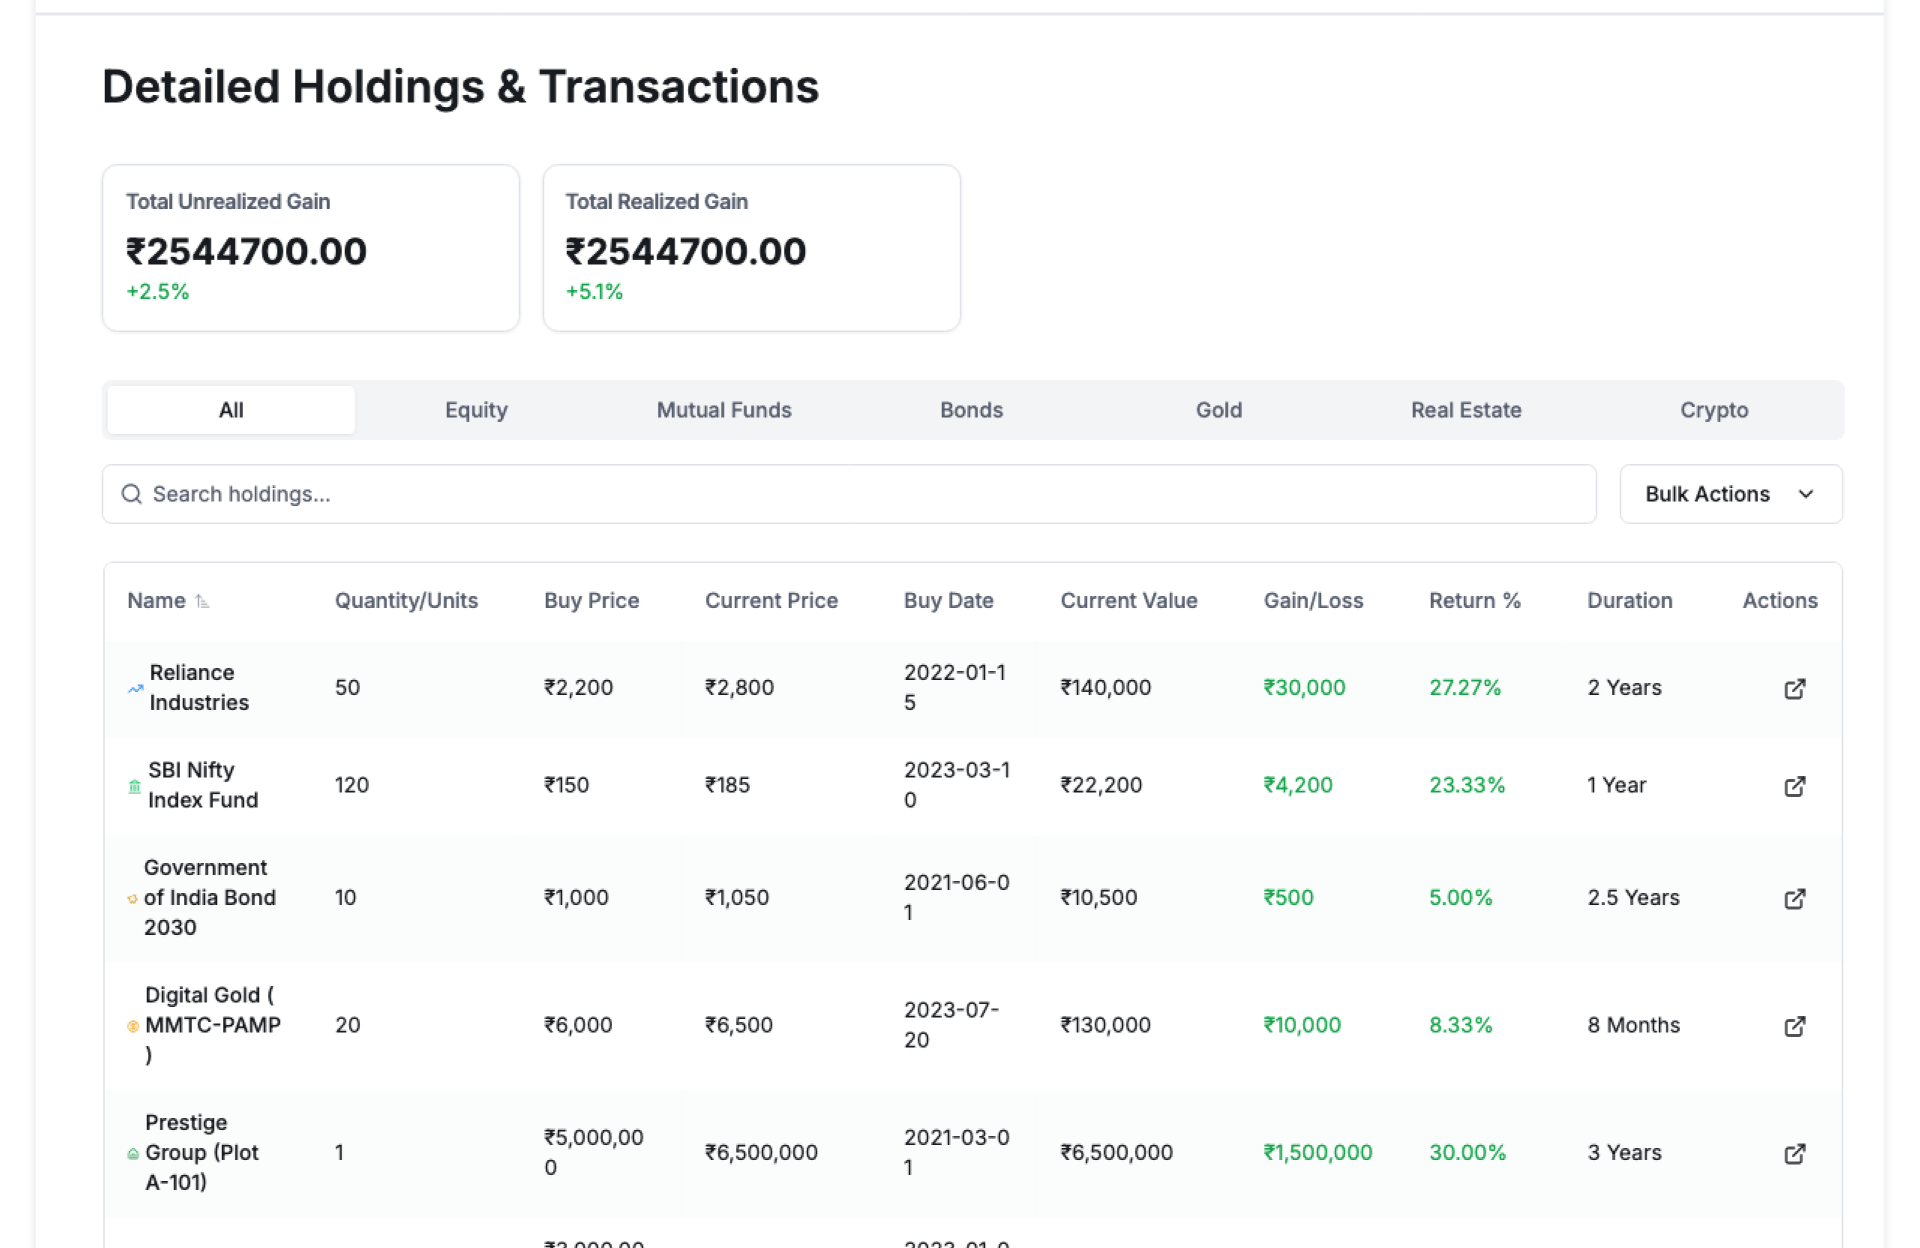
- Unified portfolio view across investments
- Real-time valuation and performance tracking
- Asset allocation breakdowns
- Gain and return calculations
- Time-based performance comparisons
- Filters by asset type, date, or account
- Export-ready performance reports
Benefits
- Centralize all investment data in one place
- Track performance without manual spreadsheets
- Identify underperforming assets early
- Improve portfolio review and planning
- Support data-driven investment decisions
- Maintain clear records for reporting
How It Works
- Add Investment Data – Upload or connect portfolio information
- Define Views & Metrics – Choose performance and allocation KPIs
- Track Performance – Monitor values and returns over time
- Analyze Trends – Compare performance across periods
- Report & Review – Export insights for planning or audits
Add-ons & Integrations
- Transaction Summary Dashboard
- Expense Classification Tool
- Finance Analytics Module
- Data Import & API Connectors
- Reporting & Visualization Tools
Deployment & Access
- Web-based interface
- Cloud or on-premise deployment
- Secure data handling and controls
- Role-based access and permissions
What Our Partners Are Saying

"Company AI-powered interfaces have been praised for their usability ,Through exhaustive research and advanced automation, Kriatix made the application fluid, accessible, and future-ready for all users. The team adapted quickly to deliver complex AI-driven tasks and independently developed creative, detailed solutions. Their AI chatbot services stood out in particular — seamlessly integrating conversational AI that enhanced user engagement and streamlined support."
Amit Kumar
Co-Founder, Venture Transform Strategy Consulting LLP

"Kriatix.ai delivered the AI-powered application on time, leveraging Agile methodology to ensure flexibility and efficiency. The team conducted bi-weekly demos, keeping the project transparent and aligned with our goals. Using Jira, GitHub, and Slack, they maintained flawless communication and streamlined project management.Their integration of AI chatbots for real-time feedback loops accelerated our release cycle by nearly 25% and reduced manual validation efforts by 40%, resulting in a smoother, faster, and higher-quality delivery."
Sumit Kumar
CEO, HImalayan Basket Private Limiteds

"The AI-powered website delivered by Kriatix.ai is both visually appealing and high-performing they built a website that not only impressed us with its sleek design but also outperformed our expectations in speed and functionality. Their team worked as true partners—creative, experienced, and highly attentive to every detail.By integrating AI personalization and intelligent chatbots, the website now adapts to user behavior in real time, leading to a 35% increase in engagement and a 25% reduction in support queries."
Sneha Das
CEO, Ittisa
"Kriatix.ai completed the deliverables with excellence, often going the extra mile by suggesting AI-driven alternatives to our change requests. The workflow was seamless, with the team being timely and proactive in addressing every issue. They set realistic expectations, built intelligent automation into our processes, and delivered results with superb quality.Their AI chatbot integration not only streamlined support but also improved responsiveness, ensuring our users always received accurate and instant assistance."
Gururaj Mahale
Director of Growth Marketing, SYNERGOS
Frequently Asked Questions
Can it track multiple asset types?
Yes. The dashboard supports tracking across different investment categories.
Is historical performance available?
Yes. You can analyze returns across different time periods.
Can data be exported for reporting?
Yes. Reports can be exported for reviews and compliance.
Can portfolios be customized?
Yes. Views and metrics can be tailored to investment strategy.
Is investment data secure?
Yes. Enterprise-grade security and access controls are applied.
Ready to Automate Smarter with Kriatix?
Build next-gen, AI-powered apps and workflows—faster, smarter, and tailored to your industry.
Get StartedRelated Products