Short-Term Rental Occupancy Chart
Visualize Occupancy Trends Across Short-Term Rentals
Short-term rental occupancy chart


See Short-Term Rental Occupancy Chart. In Action
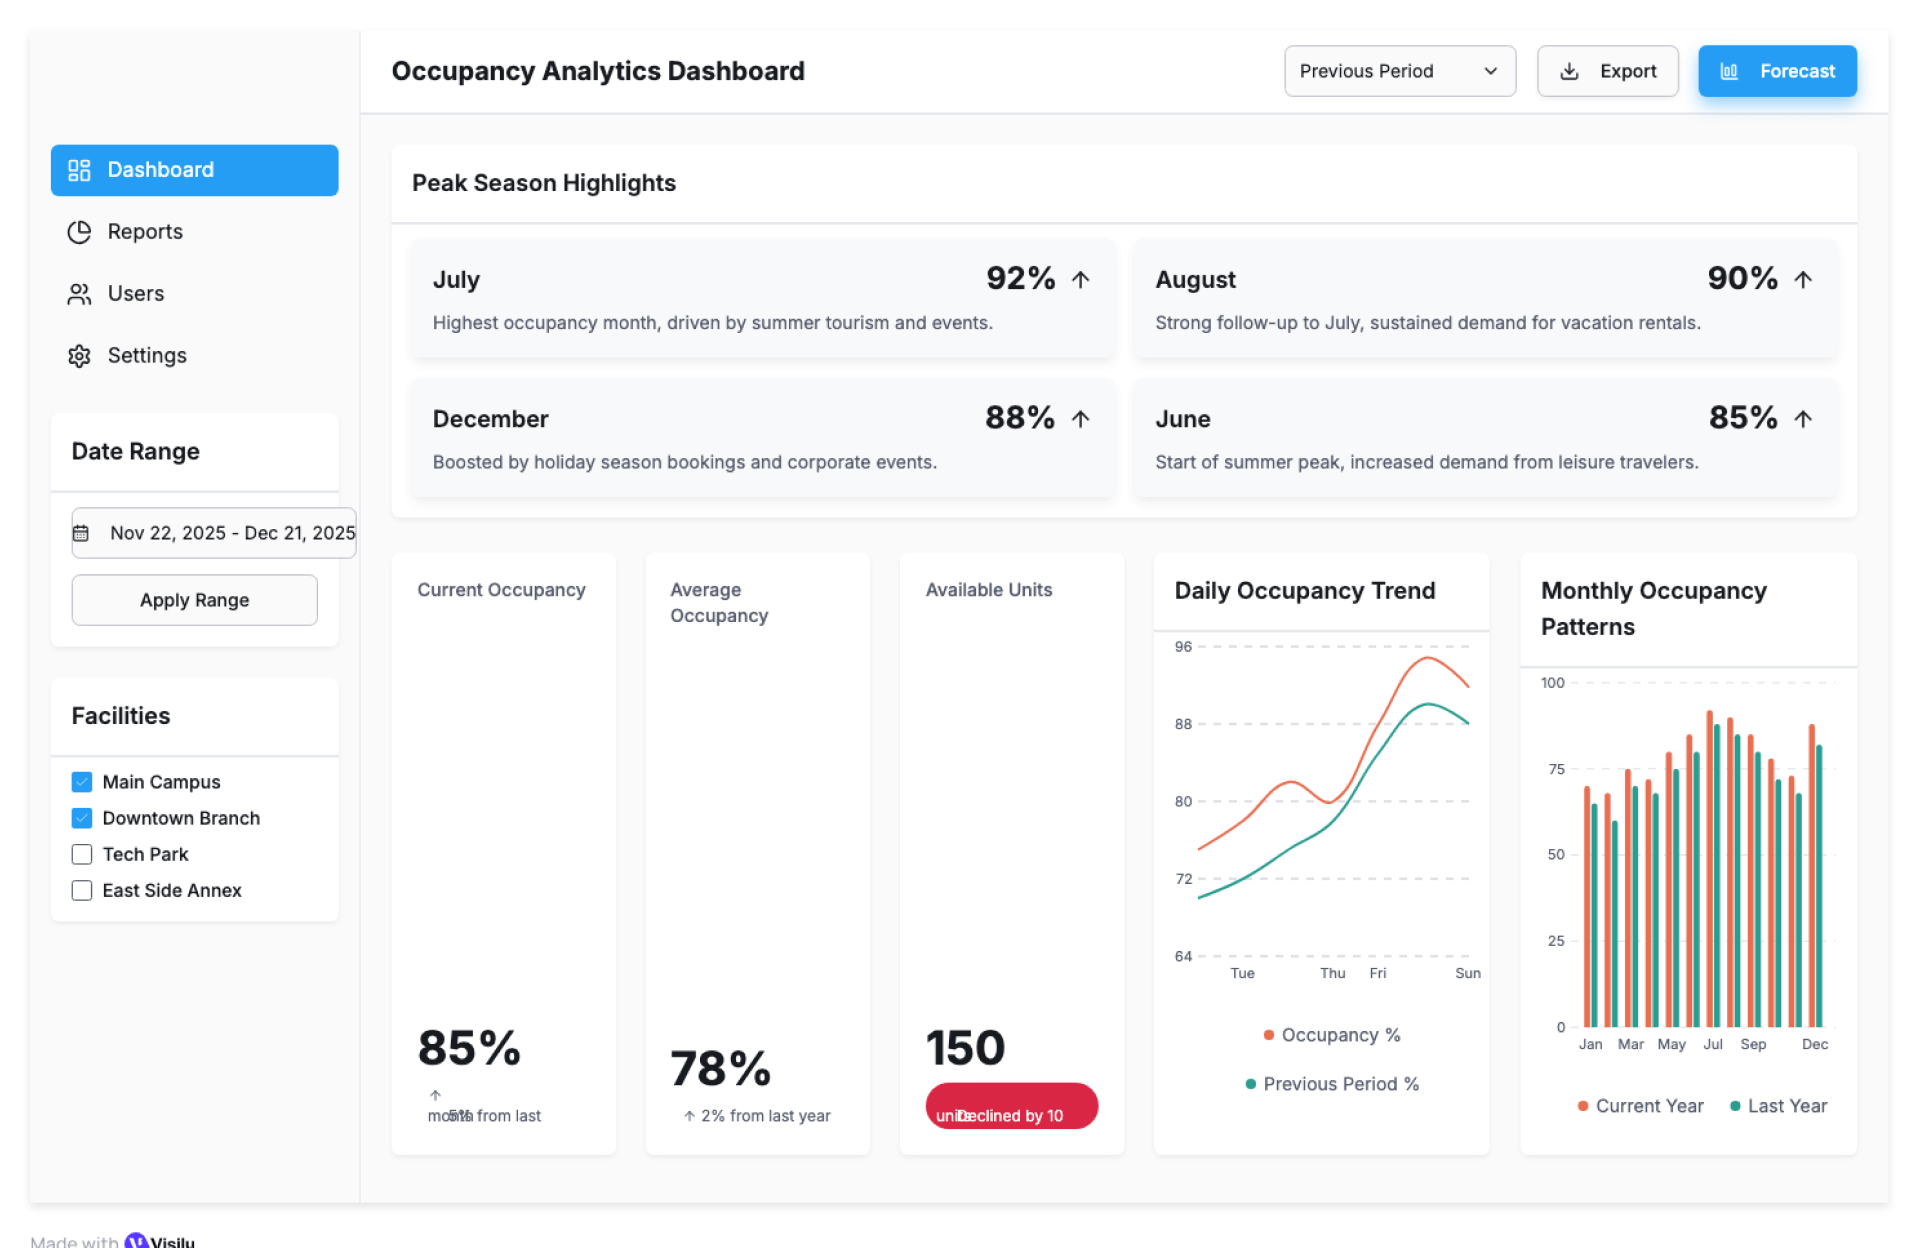
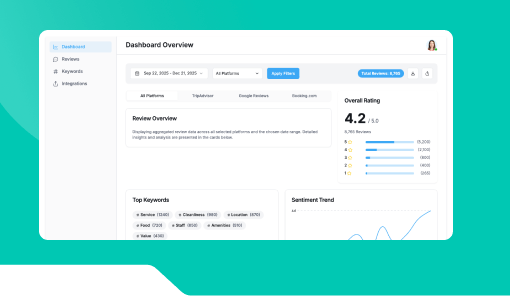
The Short-Term Rental Occupancy Chart by Kriatix helps property owners and managers visualize occupancy performance across short-term rental properties. It presents clear charts showing booking trends, utilization rates, and seasonal patterns to support better planning decisions.
🔹 Start Free Trial
🔹 Book a Demo
🔹 Request Pricing
What Is the Short-Term Rental Occupancy Chart?
The Short-Term Rental Occupancy Chart is an AI-powered analytics visualization tool that converts booking and stay data into intuitive occupancy charts. It enables teams to quickly assess performance and identify demand trends across properties.
Who Is It For?
| Role | How They Benefit |
|---|---|
| Property Managers | Monitor occupancy performance |
| Short-Term Rental Hosts | Identify peak and low seasons |
| Revenue Managers | Optimize pricing strategies |
| Operations Teams | Plan staffing and maintenance |
| Investors | Evaluate property utilization |
Key Features
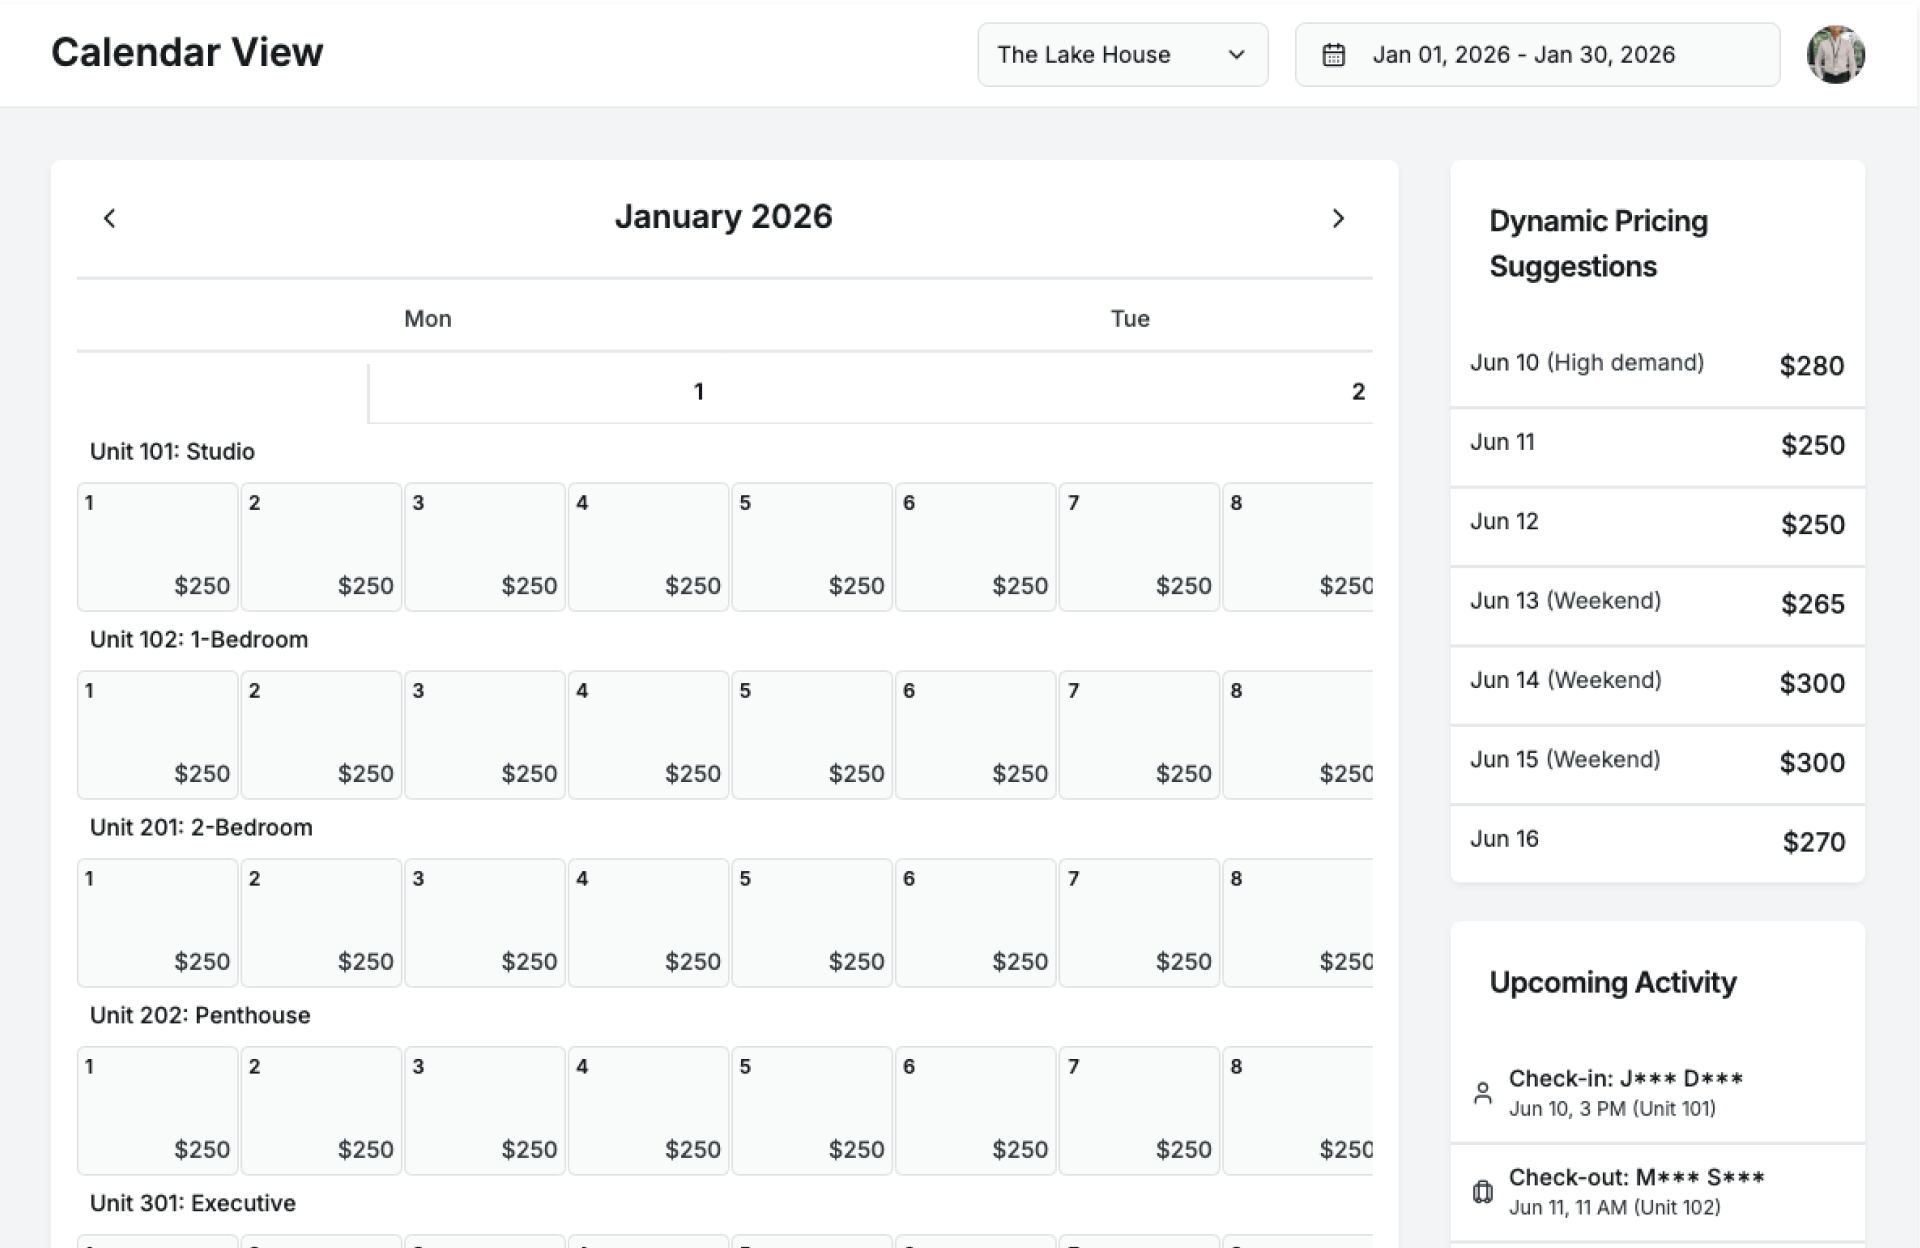
- Occupancy rate visualization
- Daily, weekly, and monthly views
- Property-wise occupancy breakdown
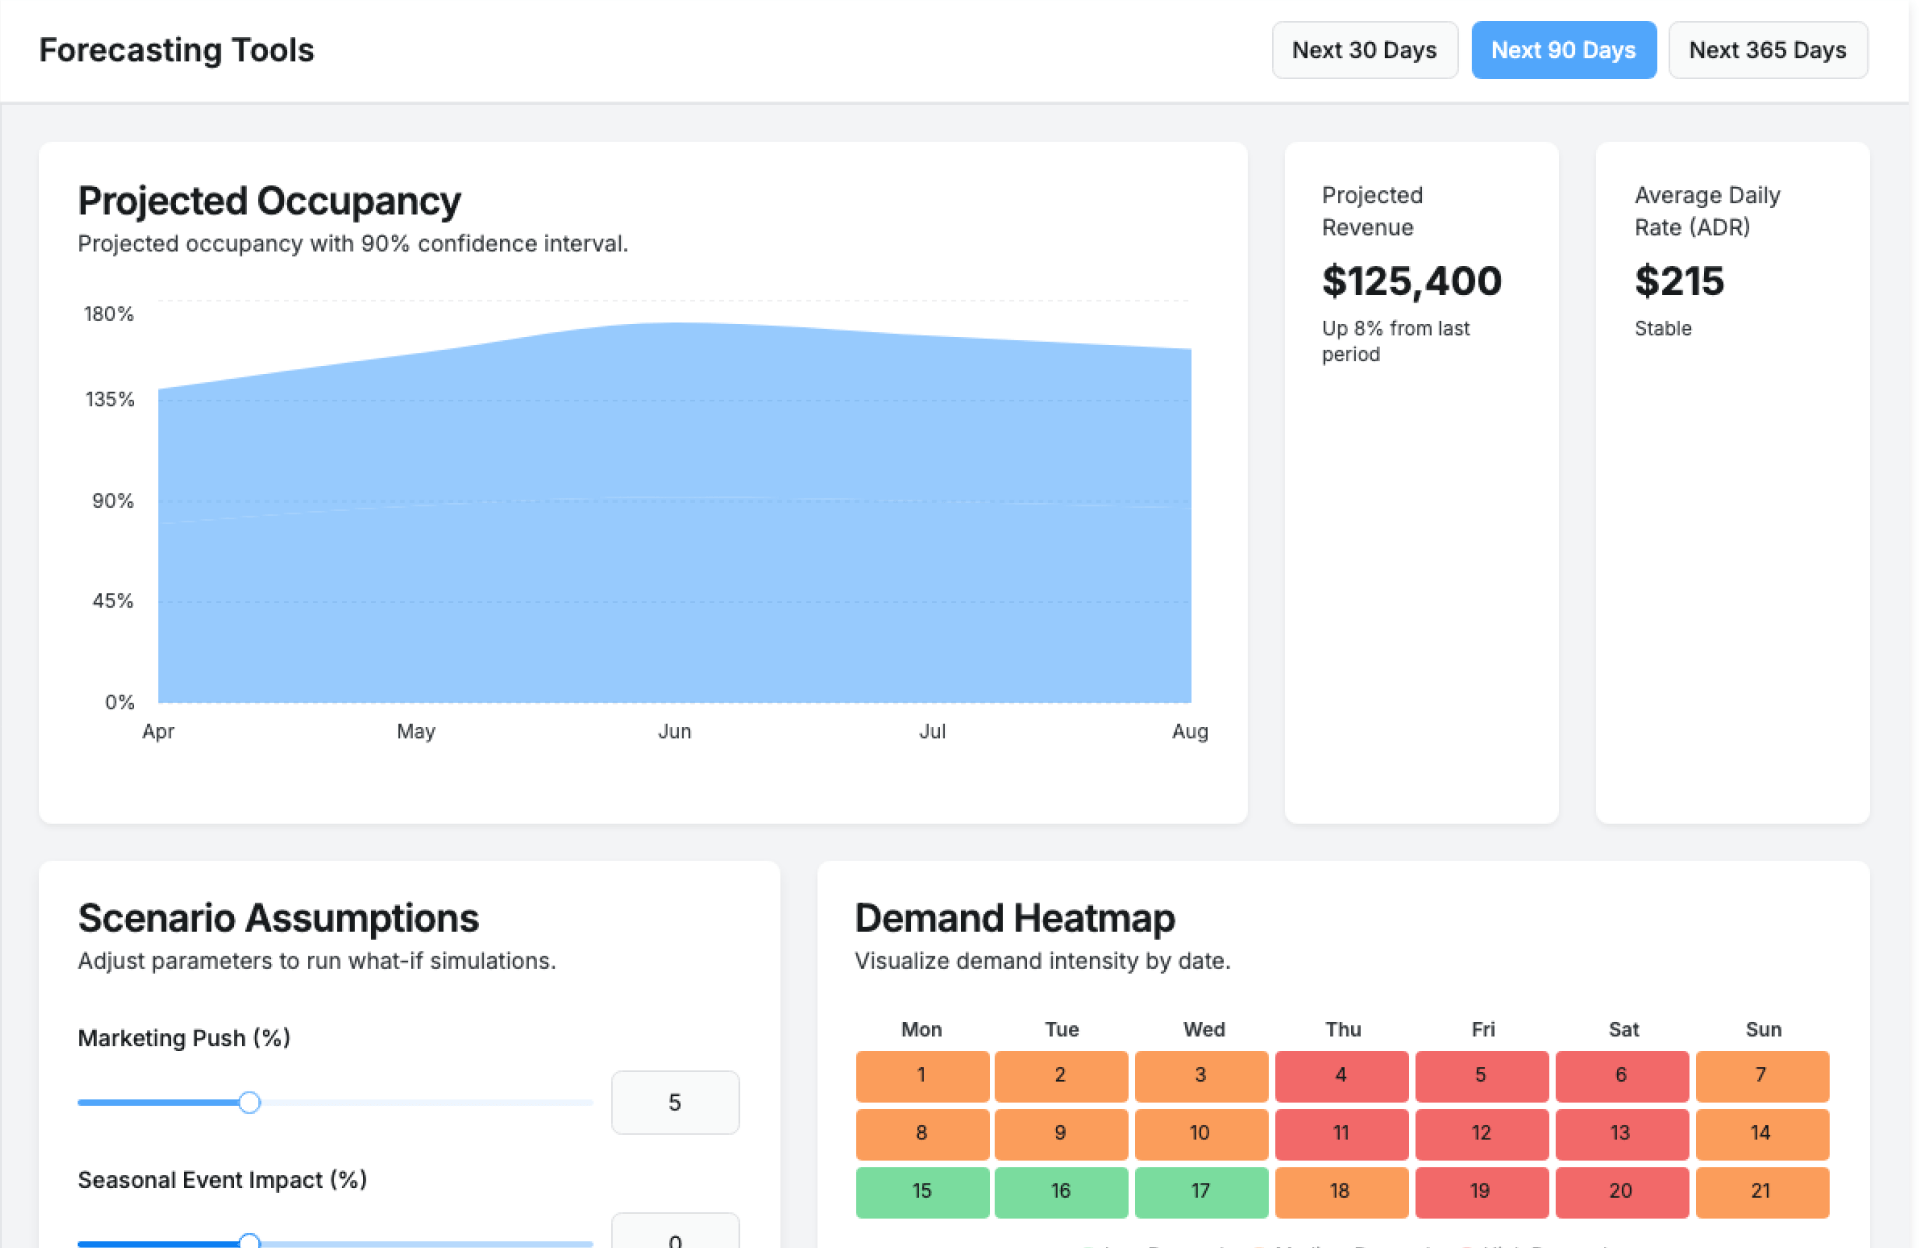
- Seasonal trend analysis
- Filters by date and property
- Exportable charts and reports
- Historical occupancy tracking
Benefits
- Gain clear visibility into occupancy trends
- Identify high and low demand periods
- Support pricing and availability planning
- Improve property utilization
- Reduce manual reporting effort
- Make data-driven decisions
How It Works
- Ingest Booking Data – Capture stays and reservations
- Calculate Occupancy – Derive utilization rates
- Generate Charts – Visualize trends clearly
- Apply Filters – View by property or date
- Export Insights – Share charts and reports
Add-ons & Integrations
- Property management systems
- Booking and reservation platforms
- Revenue management tools
- Analytics and reporting systems
- API access for custom data sources
Deployment & Access
- Web-based dashboard access
- Cloud-hosted or On-Premise deployment
- Role-based access controls
- Secure data handling
What Our Partners Are Saying

"Company AI-powered interfaces have been praised for their usability ,Through exhaustive research and advanced automation, Kriatix made the application fluid, accessible, and future-ready for all users. The team adapted quickly to deliver complex AI-driven tasks and independently developed creative, detailed solutions. Their AI chatbot services stood out in particular — seamlessly integrating conversational AI that enhanced user engagement and streamlined support."
Amit Kumar
Co-Founder, Venture Transform Strategy Consulting LLP

"Kriatix.ai delivered the AI-powered application on time, leveraging Agile methodology to ensure flexibility and efficiency. The team conducted bi-weekly demos, keeping the project transparent and aligned with our goals. Using Jira, GitHub, and Slack, they maintained flawless communication and streamlined project management.Their integration of AI chatbots for real-time feedback loops accelerated our release cycle by nearly 25% and reduced manual validation efforts by 40%, resulting in a smoother, faster, and higher-quality delivery."
Sumit Kumar
CEO, HImalayan Basket Private Limiteds

"The AI-powered website delivered by Kriatix.ai is both visually appealing and high-performing they built a website that not only impressed us with its sleek design but also outperformed our expectations in speed and functionality. Their team worked as true partners—creative, experienced, and highly attentive to every detail.By integrating AI personalization and intelligent chatbots, the website now adapts to user behavior in real time, leading to a 35% increase in engagement and a 25% reduction in support queries."
Sneha Das
CEO, Ittisa

"Kriatix.ai completed the deliverables with excellence, often going the extra mile by suggesting AI-driven alternatives to our change requests. The workflow was seamless, with the team being timely and proactive in addressing every issue. They set realistic expectations, built intelligent automation into our processes, and delivered results with superb quality.Their AI chatbot integration not only streamlined support but also improved responsiveness, ensuring our users always received accurate and instant assistance."
Gururaj Mahale
Director of Growth Marketing, SYNERGOS
Frequently Asked Questions
Can occupancy be viewed by property?
Yes, charts can be filtered per property.
Does it support seasonal analysis?
Yes, seasonal trends are highlighted.
Are charts updated automatically?
Yes, occupancy data refreshes regularly.
Can reports be exported?
Yes, charts can be downloaded.
Is historical data available?
Yes, past occupancy trends are stored.
Ready to Automate Smarter with Kriatix?
Build next-gen, AI-powered apps and workflows—faster, smarter, and tailored to your industry.
Get StartedRelated Products