Diversity Report Visualizer
Turn Workforce Diversity Data into Clear, Actionable Insights
Visualize workforce diversity data


See (Diversity Report Visualizer) In Action
The Diversity Report Visualizer by Kriatix is an AI-powered analytics solution designed to help organizations track, analyze, and visualize diversity, equity, and inclusion (DEI) metrics across their workforce. From hiring and promotions to pay equity and representation, this tool transforms complex HR data into intuitive dashboards and reports that support informed decision-making and compliance.
🔹 Start Free Trial
🔹 Book a Demo
🔹 Request Pricing
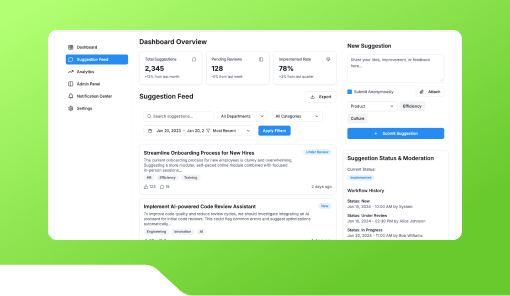
What Is the Diversity Report Visualizer?
The Diversity Report Visualizer is a ready-to-use yet fully customizable reporting solution that helps organizations measure and monitor diversity metrics in real time. Built on the Kriatix AI platform, it enables HR and leadership teams to generate visual reports, identify trends, and track progress toward DEI goals without complex data processing or manual reporting.
Who Is It For?
| Role | How They Benefit |
|---|---|
| HR Teams | Monitor diversity metrics across hiring, retention, and promotions |
| DEI Leaders | Track progress against inclusion goals and initiatives |
| Leadership Teams | Gain clear visibility into workforce representation |
| Compliance Teams | Support regulatory and audit reporting needs |
| Talent Acquisition Teams | Analyze diversity trends in recruitment pipelines |
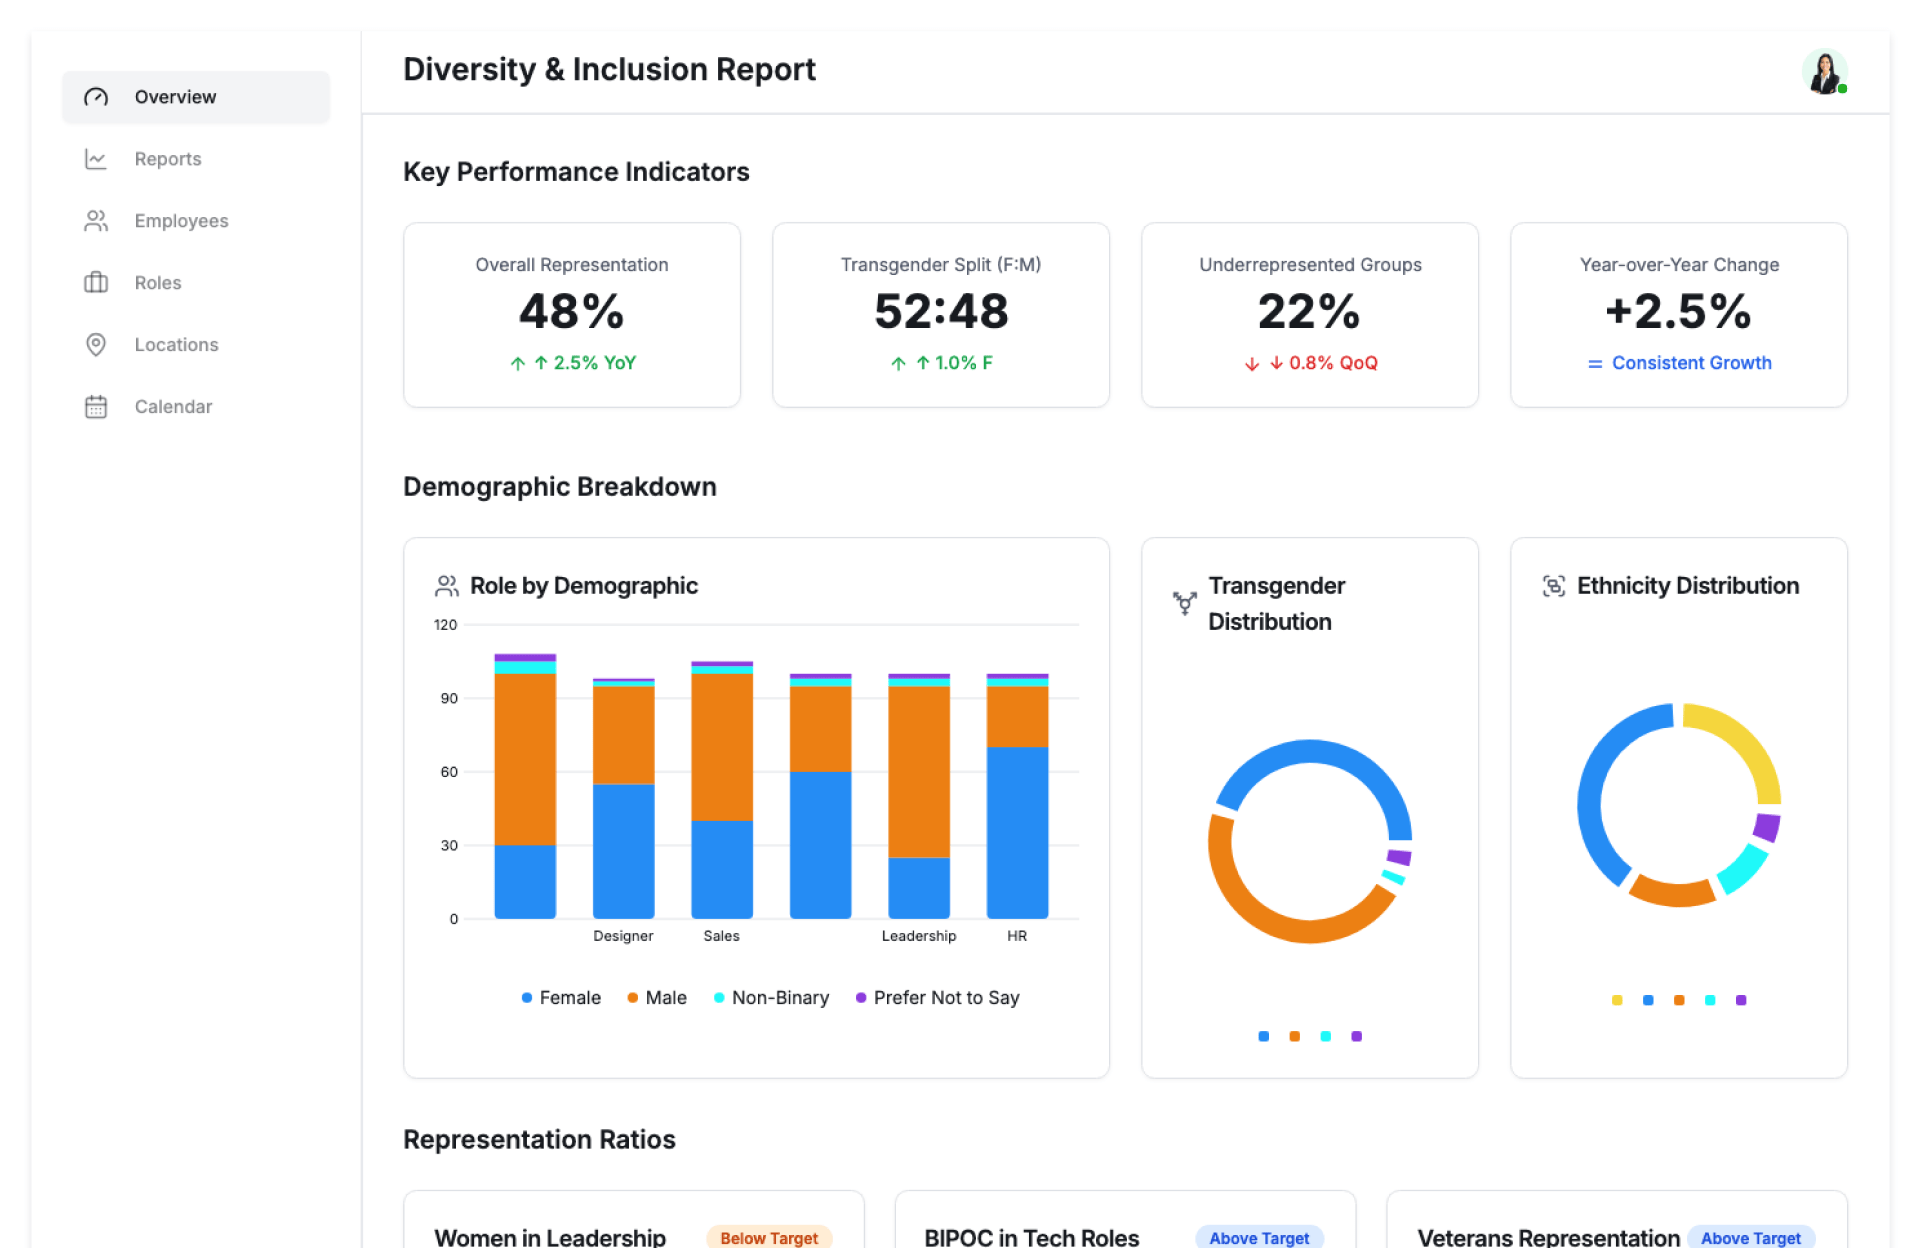
Key Features
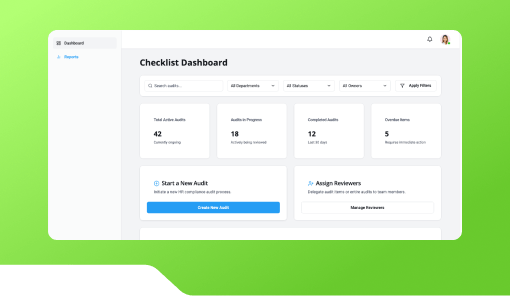
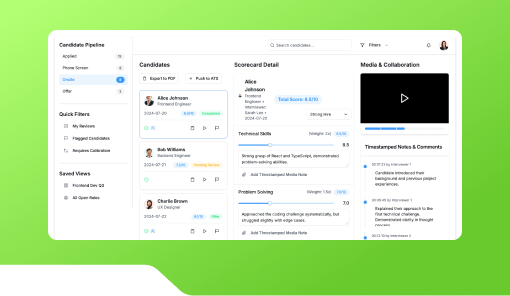
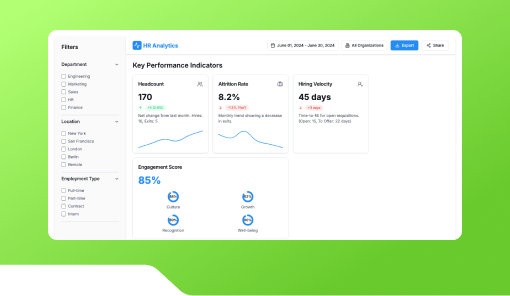
- Interactive diversity dashboards and charts
- Workforce segmentation by gender, ethnicity, age, and role
- Hiring, attrition, and promotion diversity analysis
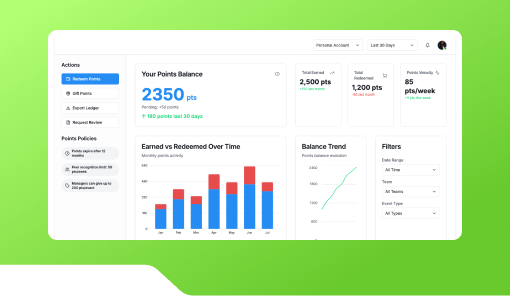
- Pay equity and compensation insights
- Time-based trend analysis and comparisons
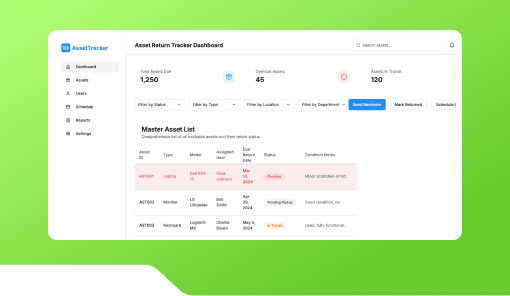
- Custom filters and report views
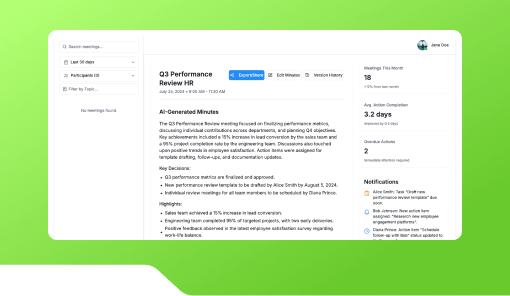
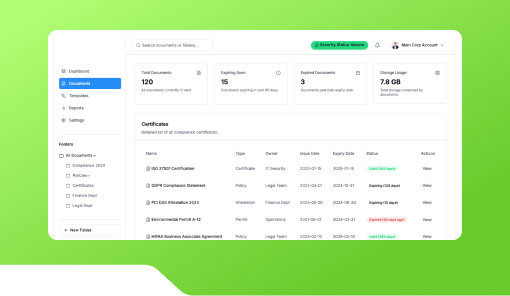
- Exportable reports for internal and external use
Benefits
- Gain transparency into workforce diversity data
- Identify gaps and improvement opportunities early
- Support data-driven DEI strategies
- Reduce manual reporting and spreadsheet dependency
- Improve compliance and audit readiness
- Share clear, visual insights with stakeholders
How It Works
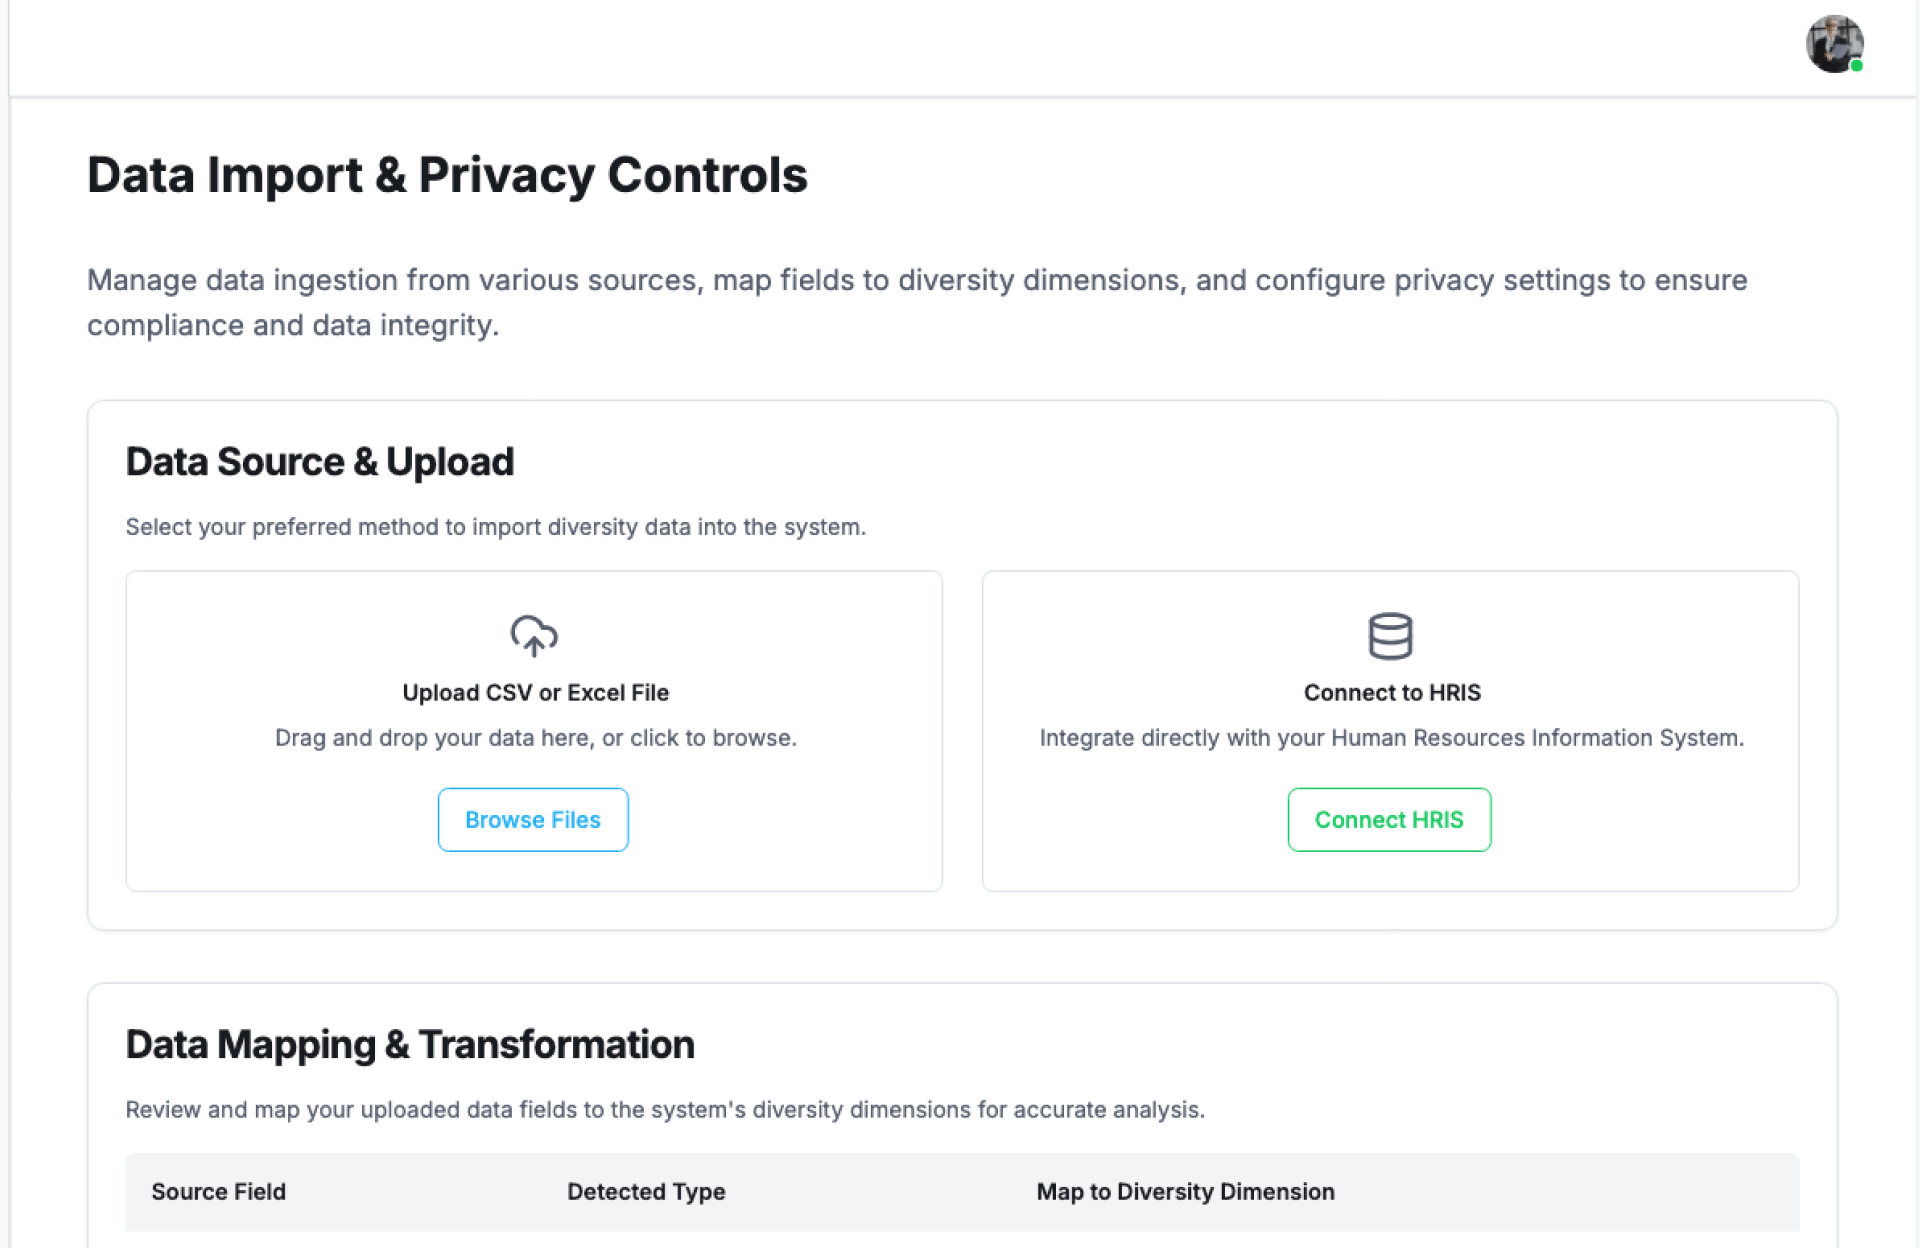
- Connect Your Data – Import HR and workforce data securely
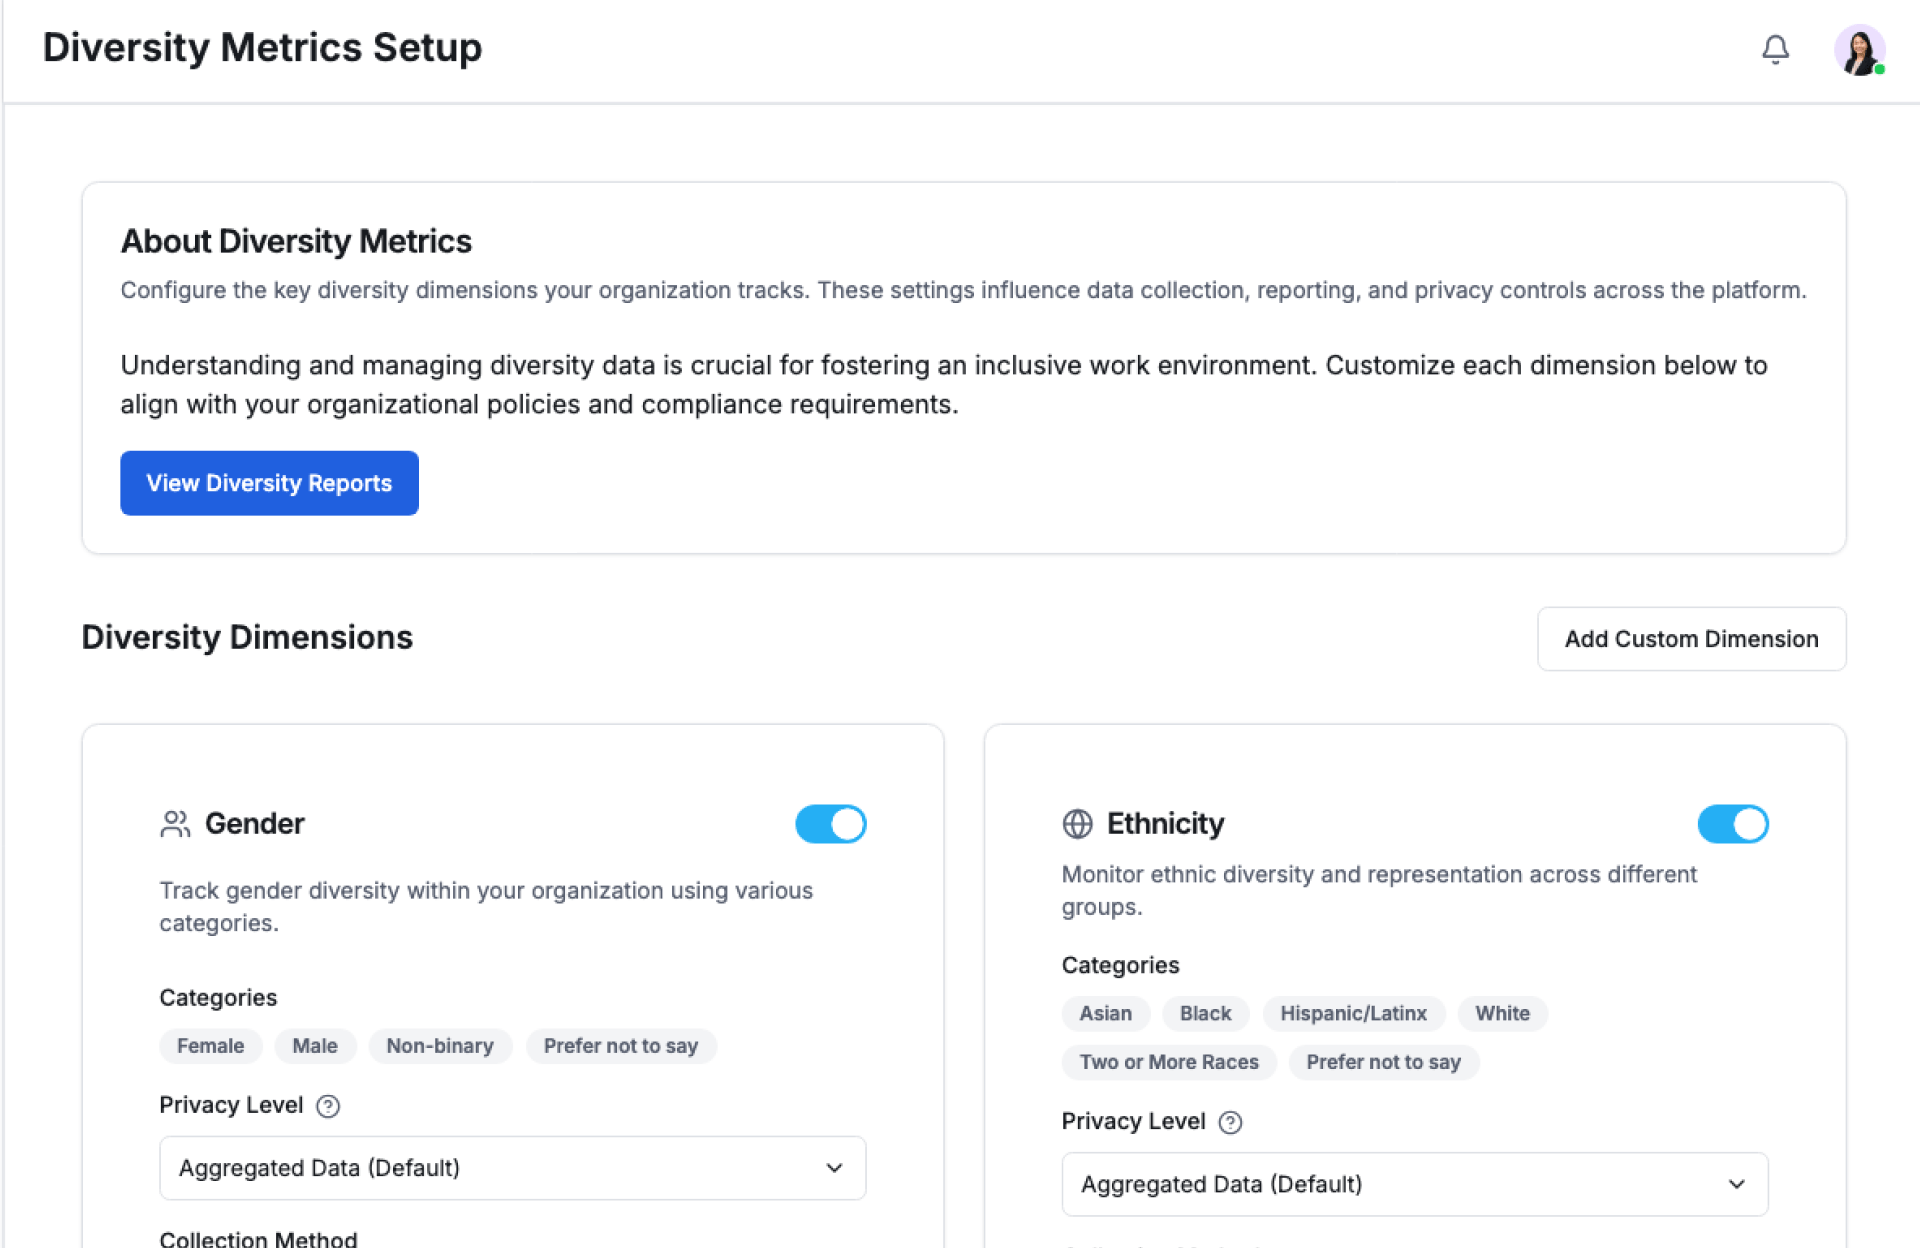
- Define Metrics – Select diversity attributes and reporting dimensions
- Visualize Insights – View dashboards, charts, and comparisons
- Track Progress – Monitor changes over time against goals
- Generate Reports – Export reports for leadership and compliance
Add-ons & Integrations
- AI-powered trend and anomaly detection
- Advanced analytics dashboard
- HRMS and payroll system connectors
- Data export to BI and reporting tools
- API access for enterprise integrations
Deployment & Access
- Web-based dashboards accessible on any device
- Cloud-hosted or on-premise deployment options
- Enterprise-grade security and access controls
- White-labeled interface for large organizations
What Our Partners Are Saying
"Company AI-powered interfaces have been praised for their usability ,Through exhaustive research and advanced automation, Kriatix made the application fluid, accessible, and future-ready for all users. The team adapted quickly to deliver complex AI-driven tasks and independently developed creative, detailed solutions. Their AI chatbot services stood out in particular — seamlessly integrating conversational AI that enhanced user engagement and streamlined support."
Amit Kumar
Co-Founder, Venture Transform Strategy Consulting LLP

"Kriatix.ai delivered the AI-powered application on time, leveraging Agile methodology to ensure flexibility and efficiency. The team conducted bi-weekly demos, keeping the project transparent and aligned with our goals. Using Jira, GitHub, and Slack, they maintained flawless communication and streamlined project management.Their integration of AI chatbots for real-time feedback loops accelerated our release cycle by nearly 25% and reduced manual validation efforts by 40%, resulting in a smoother, faster, and higher-quality delivery."
Sumit Kumar
CEO, HImalayan Basket Private Limiteds
"The AI-powered website delivered by Kriatix.ai is both visually appealing and high-performing they built a website that not only impressed us with its sleek design but also outperformed our expectations in speed and functionality. Their team worked as true partners—creative, experienced, and highly attentive to every detail.By integrating AI personalization and intelligent chatbots, the website now adapts to user behavior in real time, leading to a 35% increase in engagement and a 25% reduction in support queries."
Sneha Das
CEO, Ittisa
"Kriatix.ai completed the deliverables with excellence, often going the extra mile by suggesting AI-driven alternatives to our change requests. The workflow was seamless, with the team being timely and proactive in addressing every issue. They set realistic expectations, built intelligent automation into our processes, and delivered results with superb quality.Their AI chatbot integration not only streamlined support but also improved responsiveness, ensuring our users always received accurate and instant assistance."
Gururaj Mahale
Director of Growth Marketing, SYNERGOS
Frequently Asked Questions
What types of diversity metrics can this tool track?
It can track metrics such as gender, ethnicity, age, role distribution, hiring trends, attrition, promotions, and pay equity.
Can the dashboards be customized?
Yes, dashboards, filters, and reports can be tailored to match your organization’s DEI goals and reporting needs.
Is this suitable for compliance reporting?
Yes, it helps support regulatory, audit, and internal compliance requirements with exportable reports.
Can it integrate with existing HR systems?
The tool supports integration with common HRMS, payroll systems, and enterprise data sources.
Is the data secure?
Yes, the platform uses enterprise-grade security, role-based access, and data protection standards.
Ready to Automate Smarter with Kriatix?
Build next-gen, AI-powered apps and workflows—faster, smarter, and tailored to your industry.
Get StartedRelated Products